Currency : GBYJPY
Time : Any
When price breaks through a trend line, how can we tell whether it is a true or a false break?
Well, we can’t tell or predict until we see it later on. But, we can analyze what price has been doing prior to this breakout in order to form our own opinion and bias, and either pay attention to the breakout or disregard it.
We can always go back and look at waves pattern, or simply, whether price was making Lower Lows (LL), Lower Highs(LH), Higher Highs (HH) etc…?
Let’s look at the next two screen shots:

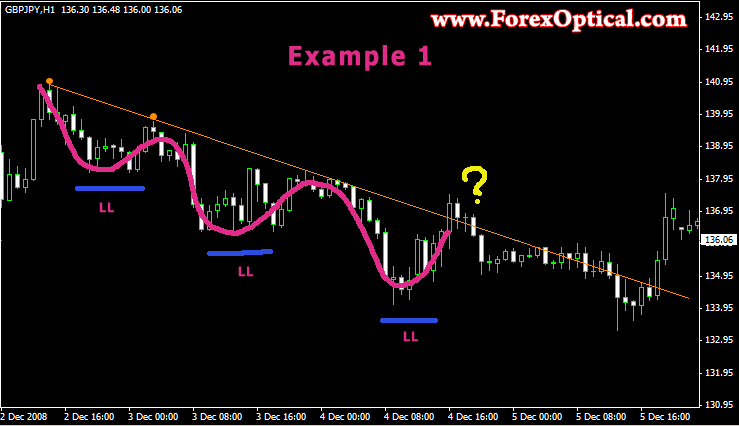
The market was in a downtrend. We drew a trend line connecting first two tops.
Price was obeying the line, but then at some point (where I put a yellow question mark), price breaks the trend line and closes above it.
How can we know at that moment whether we could trust this breakout or not?
The simplest and popular method is to wait till price returns back to test the strength of the broken trend line again. Then, if it holds, traders would say that a breakout is confirmed and enter either somewhere near the test point or when price advances through the earlier established breakout mark.
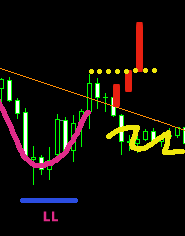
Here is a quick example (I drew the red candles myself to illustrate the point):

After the break of a trend line price returns, tests the line again, finds support and, as a result, goes up. Yellow dotted line indicates the point of entry with a Buy order.
BUT, this kind of re-tests don’t happen all the time. Sometimes price would just break the line and advance further without looking back. What to do then?
This is why I like to look back at older data to learn what happened prior to the breakout.
What can we see on the first example (first screen shot above)?
Price was consistently making Lower Lows. But, most importantly, prior to breaking a trend line, price made another Lower Low, telling us that Sellers were still strong and were able to push the price down.
Based on this, we can say that this particular breakout that we were questioning cannot be “trusted”. (I use the word “trusted”, because whether the breakout was valid or not we will only learn later).
Now, let’s look at the next example below:

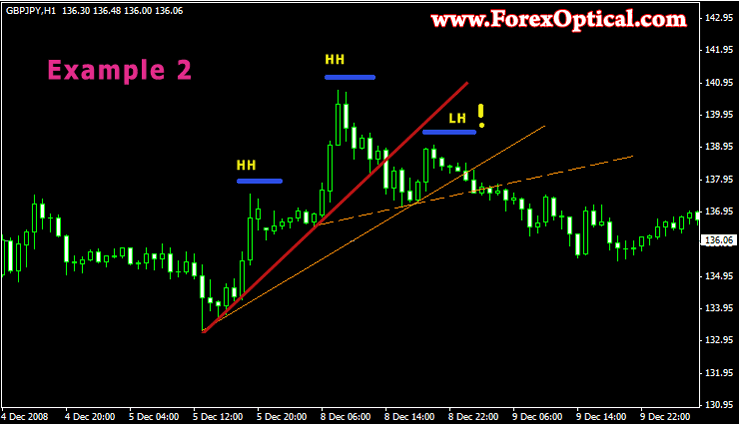
Let’s start form the beginning: price is making Higher Highs and we draw our red trend line.
At some point later the red trend line gets broken. Can we trust it? The answer is “no, we can’t”, because we still can see a higher high, which means that buyers were still able to push the price higher.
Few candles later price is bottoming out, attempts another up-move, but fails and puts a Lower High this time.
That’s nothing else but a trigger that bulls are weakening and either one of the trend lines (solid or dashed in brown) which you’ll be able to identify will become the point of truth: if it gets broken - the price is very likely to move lower.
That’s it. A simple method, which might help you to judge about most likely outcomes of the trend line breakouts.
Remember, that in the uptrend you need to take into consideration only Swing Highs, in the down trend and for downtrend trend lines - only Swing Lows.
I hope that all of you who uses this system can benefit from it and be a successful traders. Share this systems to your friends and let them try out as well.