True PA trading using MA's for S/R

eohater
"One for all, and all for one" Member Since May 2008
10,585 Posts


Quote:
Originally Posted by rattyo
I know EU S/R levels blind folded. Fib Levels coming out my ears LOL.

But taking positions of these candles is a new phenomen for me.

Another question regarding MA’s

I was taught 20EMAs and 50SMAs. MA’s lag so waiting for crosses of 20’s and 50’s normally I have missed the move especially on timeframes above 15min…On ranging markets MA crosses are worthless for entries it seems to my cost.

I notice your using 10, 21, 200 62 etc…Ive seen others on other threads use 14 100 etc.

My mentor told me banks use, 20ema thats why he was using…

The ma’s I use are laid out in the pdf on post#1. Most institutional traders are required to have a 200sma on all their charts. You’ll find that when price nears a 200sma, that their is action. Now take now for instance, we have cleared the m15 200sma, next in line is to go for the h1 200sma, which will be a bounce, should we get past the 200sma on the h1, you’ll find the next target to be the 200sma on the h4.

As to ma’s crossing, don’t use this for a reason to enter, use it for management of your position. Let’s say for instance that you’ve taken a long position and the h1 10 and 50 have crossed and pointing in a northerly position. Your long position should be covered just below the cross price. Price can come back to this point before continuing north, or it could just wipe out the cross completely. Crosses of the ma’s are not a signal to enter or take a position, it’s simply further confluence for your position. MA’s follow price, not the other way around.

Trade well!


Trade what you see NOT what you expect.

eohater
"One for all, and all for one" Member Since May 2008
10,585 Posts


Quote:
Originally Posted by rattyo
Ive read the PDF and understand these aspects.

What I want to know is WHY 62ema is a dynamic support level on an hour chart…

theres other people using 14emas on 5 min charts…Others using 200 ma on the daily is the trend etc…

People say who cares as long as your making pips…But I’d like to know where people pluck these MA’s numbers from…

The ma’s in this system, method, of trading have been complied from trial and error. It helps me see what I’m looking for. Remember how an ma is comprised. It’s simply a smoothing of price over a specified period of time (candles).


Trade what you see NOT what you expect.

Good Morning All: I want to make a comment about the overall idea of this system I think the overall goal gets missplaced sometimes… The idea behind this strategy is

No. 1. To help us to identify major areas where price may change direction . By using our higher time frame charts. Then plotting our S/R lines and channels or trendlines. That gives us our targets or areas of interest.

No.2 when price aproaches these areas we then can zoom down or look at our lower time frame charts for PA to develop and a formation of a entry signal. Targeting another Area of interest off our higher time frame charts to take profit.

No.3 If price is in a tight range or consolidation the use of the entry ideas can allow us to add to our profits by scalping or short term trades.

I mention this as the main goal should be to hold longer term trades. While possiblly taking counter trend or scalping trades on a different account or hedging your normal one. I post charts showing many entries. But concentrate on the extreme ones at the outer edges of the price. Those are the most profitable entries the others show possible secondary entries if you missed the first and then countertrend trades. I am not showing those saying take them all. Trying to would just confuse most people and not help.

But as mentioned in the past the idea Eo and Infinty have placed here are to make it possible to make positive profits in any market condition. Just as you don’t use bird shot to hunt Bear . We need the options that this overall System provides to stay focused on our goal to make profits. Just don’t lose the ultimate goal of learning to hold those longer term trades.

                      Great Trading To All  Ken

Hi.

I got questions about 2 signal that I marked on the picture.

First it was a test of previous price action ( shooting star and 50 fib ), plus 10 EMA and 200 SMA held. Second 5 o`clock trade. So technically looks good. But I see also :
1 - long bullish shadows rejecting area of PPA .
2 – I didn’t see chance to set tight SL .

Should I trade this two setups ? If yes, what SL should I pick ?


When taking trades away from the MA’s the place ment of stops is usually dictated by the other MA’s . Place them the otherside of either next ma or the next major ma. like a trade off the 10 stop could be behind the 21. But as we have major ma’s in the area we might as well use them to our advantage. Also on candle A I think you have it on your chart also a very faint line which is the 62 ema. Plus I have a resistance line there myself off a daily chart. 1.627* area. But as I stated any trade on a news candle has great risk just be aware of that risk.


Another view


We don’t you use fibs here but the 35/50 and the 62 ema 1 Hr trades are retracemnet trades the 62 was between the 50 and 61 fib level. Just a quick glance to see if price has pulled back about half way is all we need to try a trade of it. same with the 35/50 but it was abit shallow. But a 50 ema retest is confirmation of a break of that line and your stop should be tight or you should have closed the trade when price failed to cross back over the 50 ema. Not a falure just not time yet. You can see on the next leg when price closed on the 50 ema it bounced before crossing then retested on the break going north. The ability to notice this things and respond to them is what is neede to do well. No reason to just give away pips. Close and look for the right trades. I agree with you about the higher time frames . But some times they don’t workout. And a 4 hr candle is just 16 15 min candles so any change in that 4 Hr bias has to start on the 15 min. Don’t feel bad I got caught on that shooting star on the e/j earlier Didn’t notice the hammer on the 4hr. Conflicting but the 4 Hr won LOL…

Originally Posted by The Captain
Thanks again! Wasn’t even looking at the mistress today as I was ready to backhand the Mrs. and leave her forever! I think I need to start using a more strategic stop loss, based off MA’s. Hopefully I can catch her when she breaks out of this range. Peace to all.

Not to beat a dead Horse, But the 5:00 trade is a short only a 1:00 is the same for a long but only in a uptrend. Unless I have taken a long from a s/r area I tend to wait to change my bias only when the price changes to the otherside of the major ma’s. So I look for shorts below and longs above except for our signals and 35/50 and 62 ema trades.


Good Trading To All ; Ken Lee

Hi kenneth,

A small doubt , for the 1 &5’0 clock trades ,do we need to wait for the close of the candle which touches the MA and also do we see the price action on that candle. Because in the PDF I see some the trades you have taked was jus a touch of the MA’s.

They are generally touch trades . But a lot of times confirmed by PPA at a area that supports the move . Lots of times they retest minor s/r areas . look at the 5 and 10 ema 1.6250 area retested and a 1:00 trad entry on touch of 5 or near 10.

Ken,
I think adding the info from this post and the recent post on looking for your stop areas first to your new PDF would be a good idea. (unless it’s too late)
Thanks for all your help
Jack

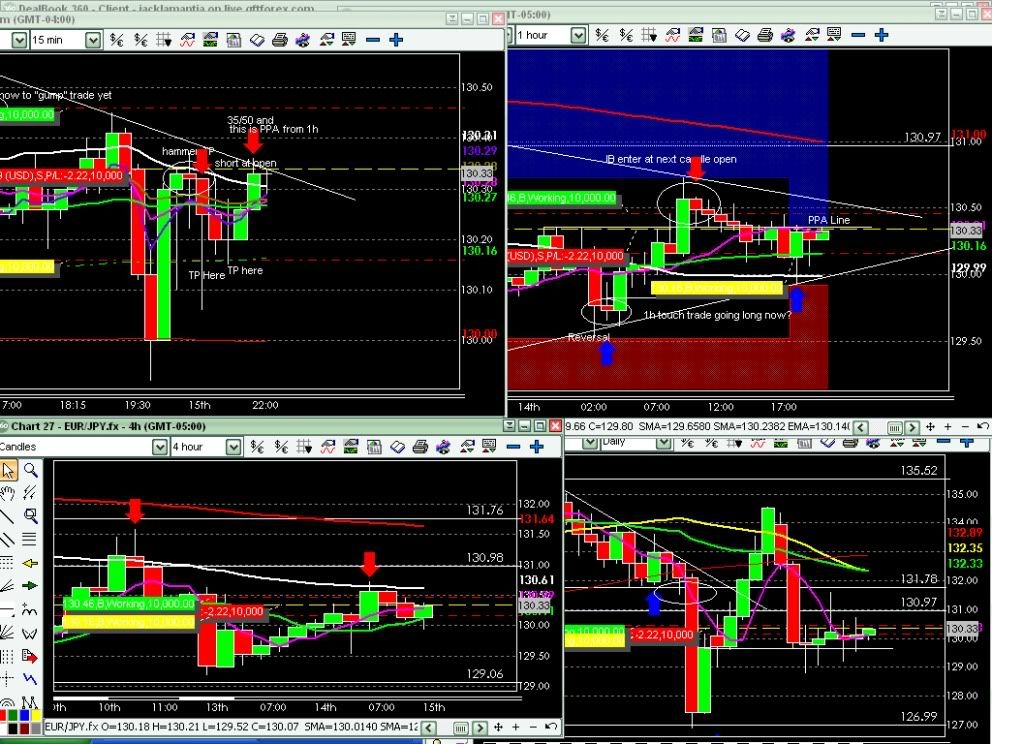
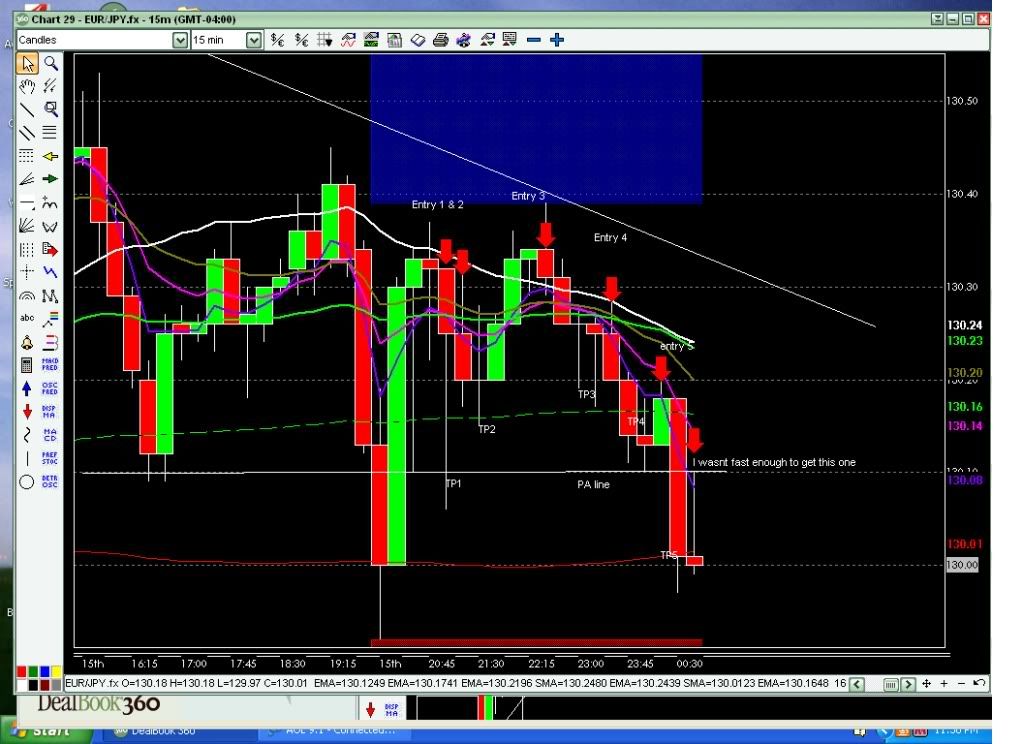
Ken & everyone - Tonight I am trying to figure out what you mean by Gump trades and how to trade them- When pricing is just boucing up and down in a tight range. Right now I am only looking at shorts as that is where it looks like to me price will be heading. (and I dont know much) I am shorting at what looks like to me the PA line from the 1h chart & then take profit at the 1hr 62ema. Ken I added the 248ema dotted line on the 15m like you suggested and it seems to be helping me. So far 2 good quick trades and 3rd in progress. Here are my charts. Let me know if you have any pointers.
I am worried about the 4h and price going to the 50ema first b-4 heading south - Have I entered too soon? I guess time will tell!!!
Thanks
Jack

Yes the “Gump” trades make reference to the Forest gump Movie where he was playing table tennis “Ping Pong” and is normally found towards the endo of sessions when pirce starts to consolidate. You cna usually see at least oneside of the trades. By either a ma or s/r line sometimes both sides are present. I like to just take the trades with the trend That way when it breaks out I am in the correct way. But they can be traded in both directions just make sure you honor your stops. PLus almost anytime price is held abck in a area it will retest giving you a chance to enter even if you get stopped.

Yes it is to late to add the pdf is done but it was still to laarge to download and is a zip file. I hesitate to put it on here as soem have had trouble opening it and I know nothing about it. I didn’t transfer it to the pdf . someone else did. maybe I will try anyway … Ken

Nope it is even failing to download to baby Pips. Just use the links on page 2 same information …

Hey Ken,

Is the PDF you reference on post 2 the first one you did or the most recent “new” one you have completed?

Thanks
Jack

The one on post two is the new one. it is 24 mb big. So Lucky lady was taking all the Jpgs that were just text and rewriting it. But it is still to big plus there was some editing so I prefer the one on post two is it is the complete information unabridged. It is compiled of the 95 posts that make up this strategy. The second PDF is a series of flash cards I made over a year ago when I first started learning this sysytem . you need to read the sysytem first … Ken

The Pdf on Post One is a group of postings from the original thread most of them by EO the thread originator…

My TP target just got hit another 13 pips. Tonight practising gump trades
3 for 3 for 49pips. :slight_smile:

2 more positive trades 5 for 5 tonight. That’s it for tonight.

Another try to download the zipped file

Not meant to be I guess

Great Trading Jack…:smiley:

Hi Ken ,

U enlightened me,…today was my lucky day…grabbed 200 pips from cable…

thnx a lot…

Way to go great trading… But it isn’t Lucky Just a new skill you are learning… Have a Great Weekend Everyone… Ken

Hi ken,

Do you look at 5 min candles for PA other than 15 min when your are at a possible reversal area ?