The Platinum set up wasnt triggered yet but iam looking forward to see an entry next week …iam prepared for booth directions but i prefer the short
if you need more details feel free to check out my little blog on truemantrades.com
next 2 weekly set ups will follow this evening or tomorrow …stay tuned traders
cheers
Hey Guys ,
Hungry for some set ups for next week 
here we go :
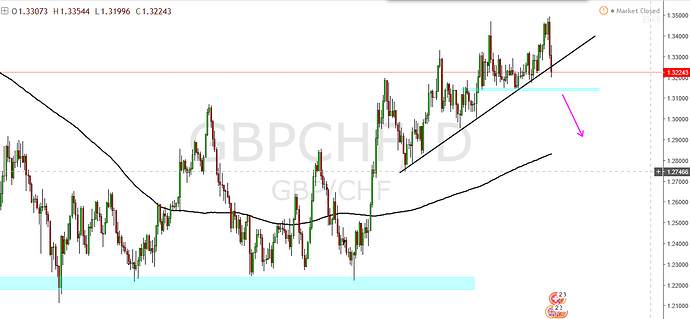
We are just about to break the upward Trend here and price already breaks the rising trendline on friday.
Just below current price we can find an interesting s/r zone which needs to break before i consider a short entry because price could easily find support here and start to push up again .
Without this s/r zone i would enter this trade depending on the monday open and daily price action but thats not the case so i will just sit on my hands until price reaches this s/r zone .
So my plan for this pair is to wait for a break n close below the zone to enter a short trade.
No break no Trade …
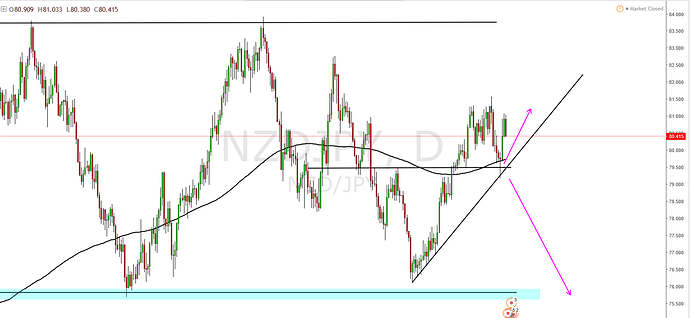
We are moving in a bigger range here and it looks like we are on the way to the top of this range again.
Price just pulled back to a well respected s/r zone and i will look for a long trade after a bullish reaction right on the s/r area ( MA gives us also kind of dynamic support here if it can hold)
The other scenario is a short trade in case price breaks the s/r zone to the downside here.
We have also kind of rising trendline but its not that important to me due to the fact that we just have several touches at the very begining of the upward move in case price respects this line and starts to offer a long opportunity i see this trendline as confirmed and we can just look for a break or rejection at the next contact with price .
week is nearly over and we had an amazing nzd jpy long… hope some of you catched that baby …
This was a beautiful example of different pieces of the puzzle working together and confirming each other well.
- our Trendline was again retested and confirmed
- the retest was a great Pinbar
- the s/r Zone was retested and was able to provide Support to Price
- the ma reacted as a Support too
Great confluence isnt it ?
All this factors together gave us a great Long trade
Like i said last week without the Support Zone i would enter on weekly open but due to that Zone i was a little bit worried
What happened ?
Price just bounced from that Zone to the upside retested the Trendline and is going south again .
So no trade was triggered for me and i will wait for a valid S/R Zone break before entering short here.
NZD CAD
We have a well respected s/r zone here which was tested 3times from above before breaking
Now we just saw the first test from underneath on the daily Timeframe.
The interesting part is that price is forming a SHS formation right under this s/r zone while the Head already retested it .
Such a formation on a location like this is a great sign that we may see a change in direction again.
Again we have 2 possibilitys for this set up
-
a break of the SHS neckline + Trendline break ( 3Touches showing us the TL is confirmed) to the downside open us a opportunity to go short here
-
invalidation of the pattern by breaking the s/r zone to the upside which would force us to overthink the whole scenario and look for a clue to go long here for example a pullback to the Trendline + s/r zone again but for now we will focus on presence not on what could be in future
Aud CAD
-we have a Daily Pinbar
-The Pinbar is forming right on a s/r zone
-we have a Trendline wich is almost confimed by the 3rd touch
A clear and simple set up for me which could be played like this :
waiting for a follow through candle in daily Timeframe to give us a"real" confirmation of the Trendline
the other possibility is a break of the s/r zone and the Trendline to the downside and shorting this pair to the 0,9700 level as a first target
We started with a nice follow through after the Pinbar right on the s/r zone and confirmed the trendline by this rejection which leads to a long entry .
Unfortunately price droped and breaks down the trendline which was our sign to close the position to prevent a full lose of -1R and change our trade idea from a long to a short .
Now depending on how you played this short scenario the trade could have been kicked by price due to some massive Cad news reaction on Friday ( in case your stop was below the last swing high ).
Now price looks like we will see more downside due to the fact that we are close below the s/r zone and outside the trendline and of course this hugh wick to the upside which shows bulls were pushed down violently after trying to break to the upside again.
Good example of a tricky trade
The Daily Chart of Nzd Cad showed us no follow through for the SHS Pattern here no break n close below trendline or neckline so no trade for us here .
This is a good example why i always wait for a candle close before taking a decision .
Traders who not waiting for it could have been short after price breaking the trendline with a glowing red candle just to see price grinding higher and leaving an indecisive candle closing above the trendline again
The h4 chart showed us also no SHS follow through , there was no neckline break as well.
You can maybe argue that the trendline was broken and price was able to close below BUT the Neckline wasnt !!
And when it comes to trade the SHS you NEED a neckline break to take a trade.
So no Short trade here .
But lets take a look at the Long side 
Trendline clearly holds .
Look at all the wicks pushing price away from the trendline followed by a strong bullish candle.
This was clearly a long opportunity .
Let me show you the same chart in a smaller timeframe to see how you could have played it :
This is H1 Chart and we need to take a look at the trendline here .
All this reactions showing us that the trendline is holding and we looking for some confirmation to go long .
So the easiest way is to look for a structure to break like another trendline in this case .
See the confirmed small falling trendline (3 touches) after price breaks through this trendline to the upside we were ready to take a long trade with a target at the supply zone right at the “head”
This is a way of stay flexible and react to the market behaviour .
First we were looking for the short and the SHS to play out but price showed us that it doesnt want to break down by respecting the rising trendline several times , time to switch our bias from short to long and adappt to the market conditions by scanning the price structure and find a break of another structure giving us a clue of the direction .
New week new luck traders
2 new set ups for you
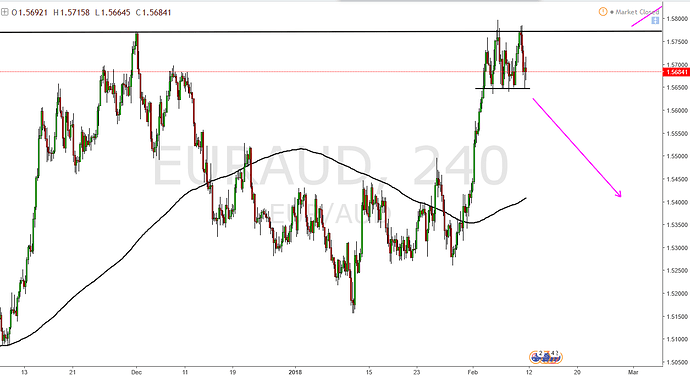
Whats my Idea for this set up ?
It looks like a classic top pattern for me .
We see price found reistance in form of a double top right at a previous swing high which provides this resistance area.
I look for a short trade after price breaks n close below the double top neckline (support) .
Looking for a target at round about 1.54500 area.
If price cant break below i look for the other direction and a break of the resistance at the top for further bullish momentum.
2 simple “If then” scenarios for this more or less classical top formation.
We are in a clear bearish market and going down since around 1year
The last weeks we can see a correction in direction of a previous s/r zone which was respected several times before price was able to break it down + extra confluence by a trendline with several touches.
Now again we have 2 scenarios which could happen here.
-
Price respects the s/r zone + the trendline giving us a great opportunity to go short into the bigger picture trend direction
-
Price breaks the trendline + the s/r zone to the upside telling us that the downward trend could come to an end and offer us a chance to go long in a very early stage of this new trend
I personaly prefer the short side cause its always better to go with the bigger picture trend than against it but if market tells us a long is the way to go i will not discuss with him 
You see the first bearish candle which closed below the s/r zone , this was the entry for me .
What happend next is 4 candles in a row cutting through the s/r zone up an down which is not a great confirmation for a further downward move for me but the first candle which has a open and a close above the s/r zone was my trigger to leave the position and take a small lose ( yellow circle) .
Good decision cause otherwise the next candle would have kicked me out for a full sl.
As you can see Monday candle gave us an entry into this nice short here .
A break n close below the light blue s/r zone was the entry trigger with a stop just above the breaking candle .
Price stays below the zone and showed nice follow through after one consolidation day .
strong Support zone tested multiple Times
Take a look at the Moving Average from below it almost matches with the support zone which makes it extra “strong” and gives me extra confluence
Now as always we have 2 possible scenarios
1)My favorite is the long here after price gets rejected by the support and the MA
a strong momentum bar to the upside or a nice Pinbar with a hugh wick is needed to drag me into a long
- price breaks the support AND the MA to the downside this would indicate a short trade for me
I would prefer a strong Bearish candle to convince me to take a short position .
- Price touched the big falling trendline ( Weekly Trendline zoom out your chart and see for yourself )
2)Price formed a Double Top right at this Trendline
3)RSI confiming a Divergence and indicating that price might go short here
I just want to see a break n close through the light blue s/r zone here .
I have enough confirmation by the 3 points above for a short now i just need this last push down breaking the structure to open a short position .
Alternative keep your eyes open for break to the upside above the Double Top this will invalid the short scenatio for now and will open some space to the upside.
Eur Usd gave us an entry on the daily after a break n close through our s/r zone and we are in a small profit at the moment now is time for manage the trade .
I personaly will try to hold until my marked target at the next trouble area is reached and i will think about a close in case price starts to rise again and is able to close above the s/r zone .
The cool thing about the trade in this Time frame is i need just to check once a day at daily close to take a decision .
So lets do market makes its thing and just check it one time a day .
Eur Jpy gave no entry to me as you can see we got rejected from that s/r level an wednesday and i will take this level to enter a long after BnC ( Break n Close) targeting the last high at a round 138.00
The Downward if then scenario is also still available but we need to see the MA break before thinking about it . If this happens the doors are open to the 128.00-127.00 level
So lets stay patient and take just clear and strong signals .
Eur Sgd
Price broke above this s/r zone to the upside and already retested it from above as you can see.
Iam looking for a short if price can break the zone and gives me a close below .
My target for the short trade would be the rising trendline .
If we arrive at the TL i wil look for:
A) break and further downside move
B) rejection and and a move to the s/r zone to the upside
Long scenario
The s/r zone gives support to the price and pushes it back up again.
I would like to see abreak of the small resistance here before thinking of a long trade in daily chart.
Nzd Cad
For a long and continuation in trend direction I would like to see that price bounce from the s/r zone + the trendline (double confirmation) could be tricky to play but that depends on price action we will see in this area .
Alternative i have the short scenario on my list with a valid break n close below the s/r zone + trendline (again double confirmation) .
But at the moment this looks like a clear uptrend with Higher Highs and Higher lows to me and as long as we stay above s/r zone and TL we have no signs of a shift in trend .
We have Higher Highs and a healthy uptrend now what COULD happen is price breaks down the s/r and TL starts to retest the s/r zone from below gets rejected and shows us the first lower high in a while and a clear sign for a change in trend direction.
But remember this is prediction and we dont want to predict we just want to react to a situation thats why i have always both price directions in my mind and all possible moves i show are just IF THEN scenarios .


