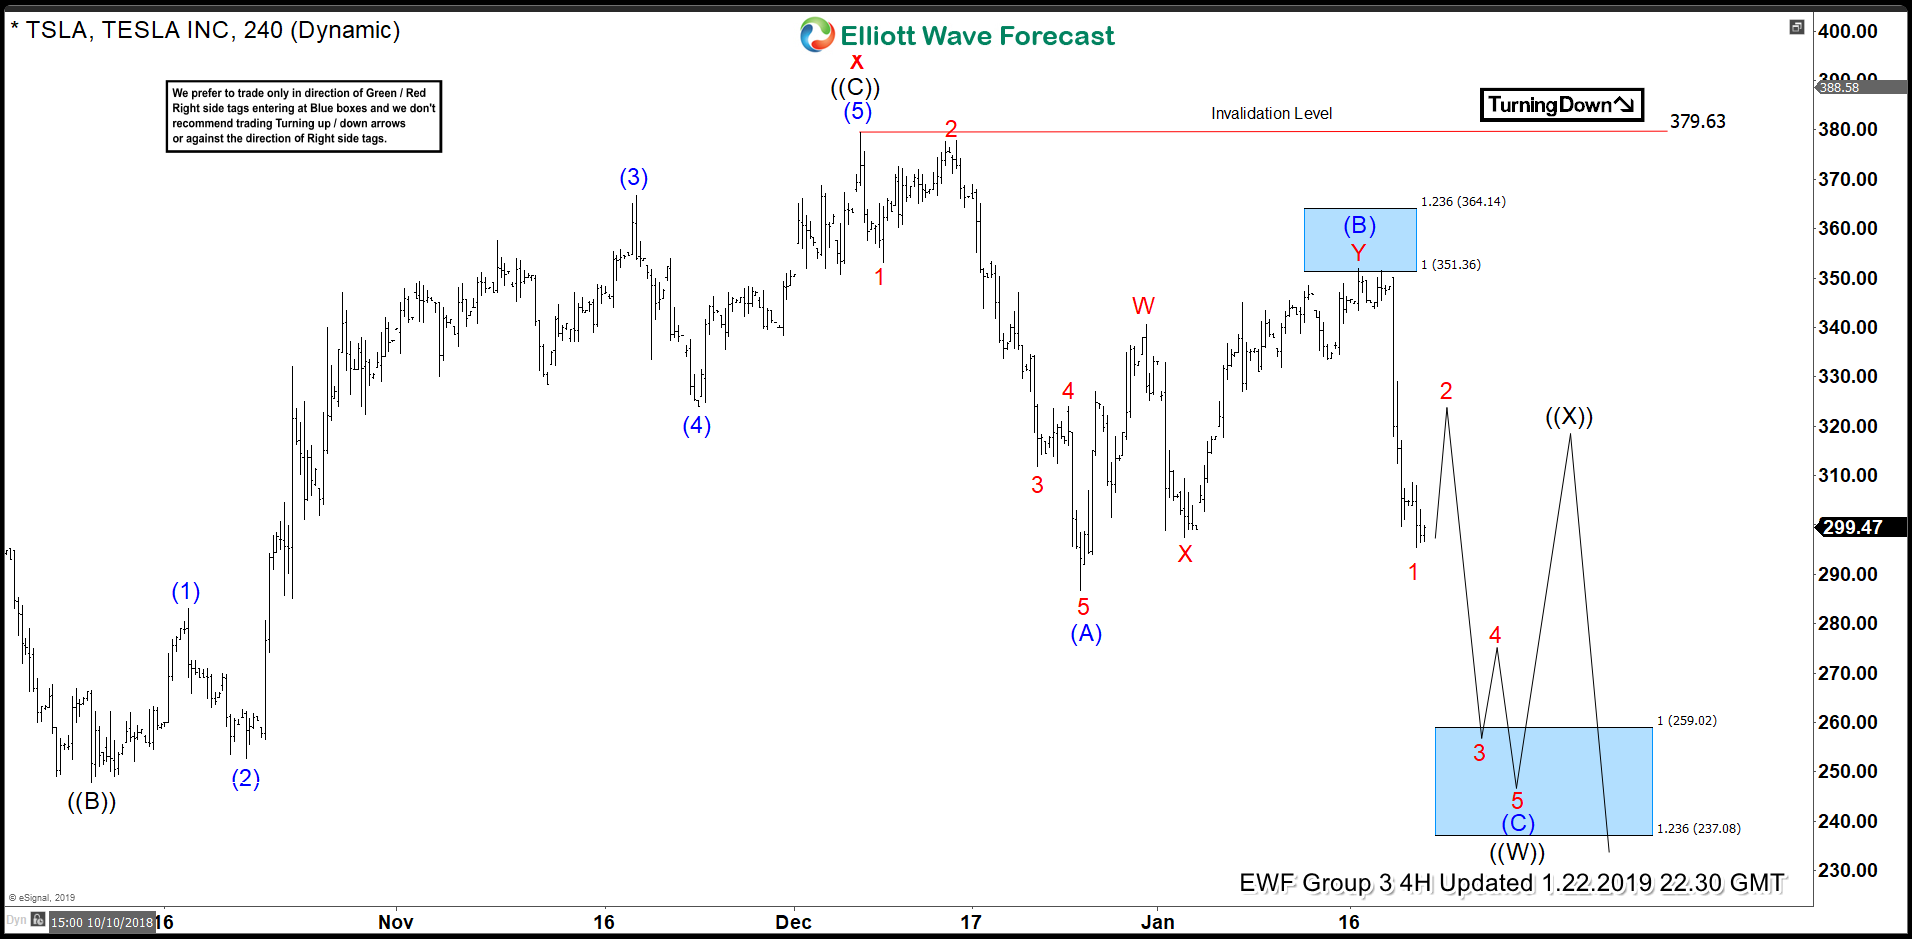
The current price action and Elliott wave analysis suggest further declines for TSLA shares. Not even a full month into the new year TSLA shares have already seen 2 large declines. The first drop was blamed on a pricing adjustments for U.S. vehicles. The 2nd drop is being blamed over layoffs and unappealing guidance. Bearish traders seem to be piling on for lower prices with nearly 20% of the stock’s float being shorted. Options traders are also buying over 2 times the amount of puts to calls as of this article’s printing.
No doubt prices of the stock look to be going lower. We never admit to be fundamental experts so as always here at EWF we look to the cycle, sequence, and Elliott wave analysis to forecast the next directional move of consequence. And, in this case, Elliott wave near term structural interpretations also call for a drop.
Since June of 2017 TSLA meandered sideways in a nearly $150 range. We now believe the stock is at an inflection point where prices can extend from the range. Current Elliott wave analysis suggests that break will be to the downside.
The Chart below is our latest 4hr interpretation of TSLA. While under the “x” wave (in red) high near 380 we see prices extending to at least 260. From there we can expect a bounce higher in 3 waves minimum. As long as this bounce remains under the “invalidation level” at the top of the chart the stock will be poised to move lower to levels not seen since early 2017 in the projected wave ((Y)).
TSLA 4hr Chart

TSLA Poised to take out 2018 Lows
Wishing you Success!