S&P/TSX is a major stock market index which tracks the performance of largest companies by market capitalization on the Toronto Stock Exchange in Canada. It is a free float market capitalization weighted index. The index covers approximately 95 percent of the Canadian equities market. The S&P/Toronto Stock Exchange Composite Index has a base value of CAD1000 as of January 1, 1975.
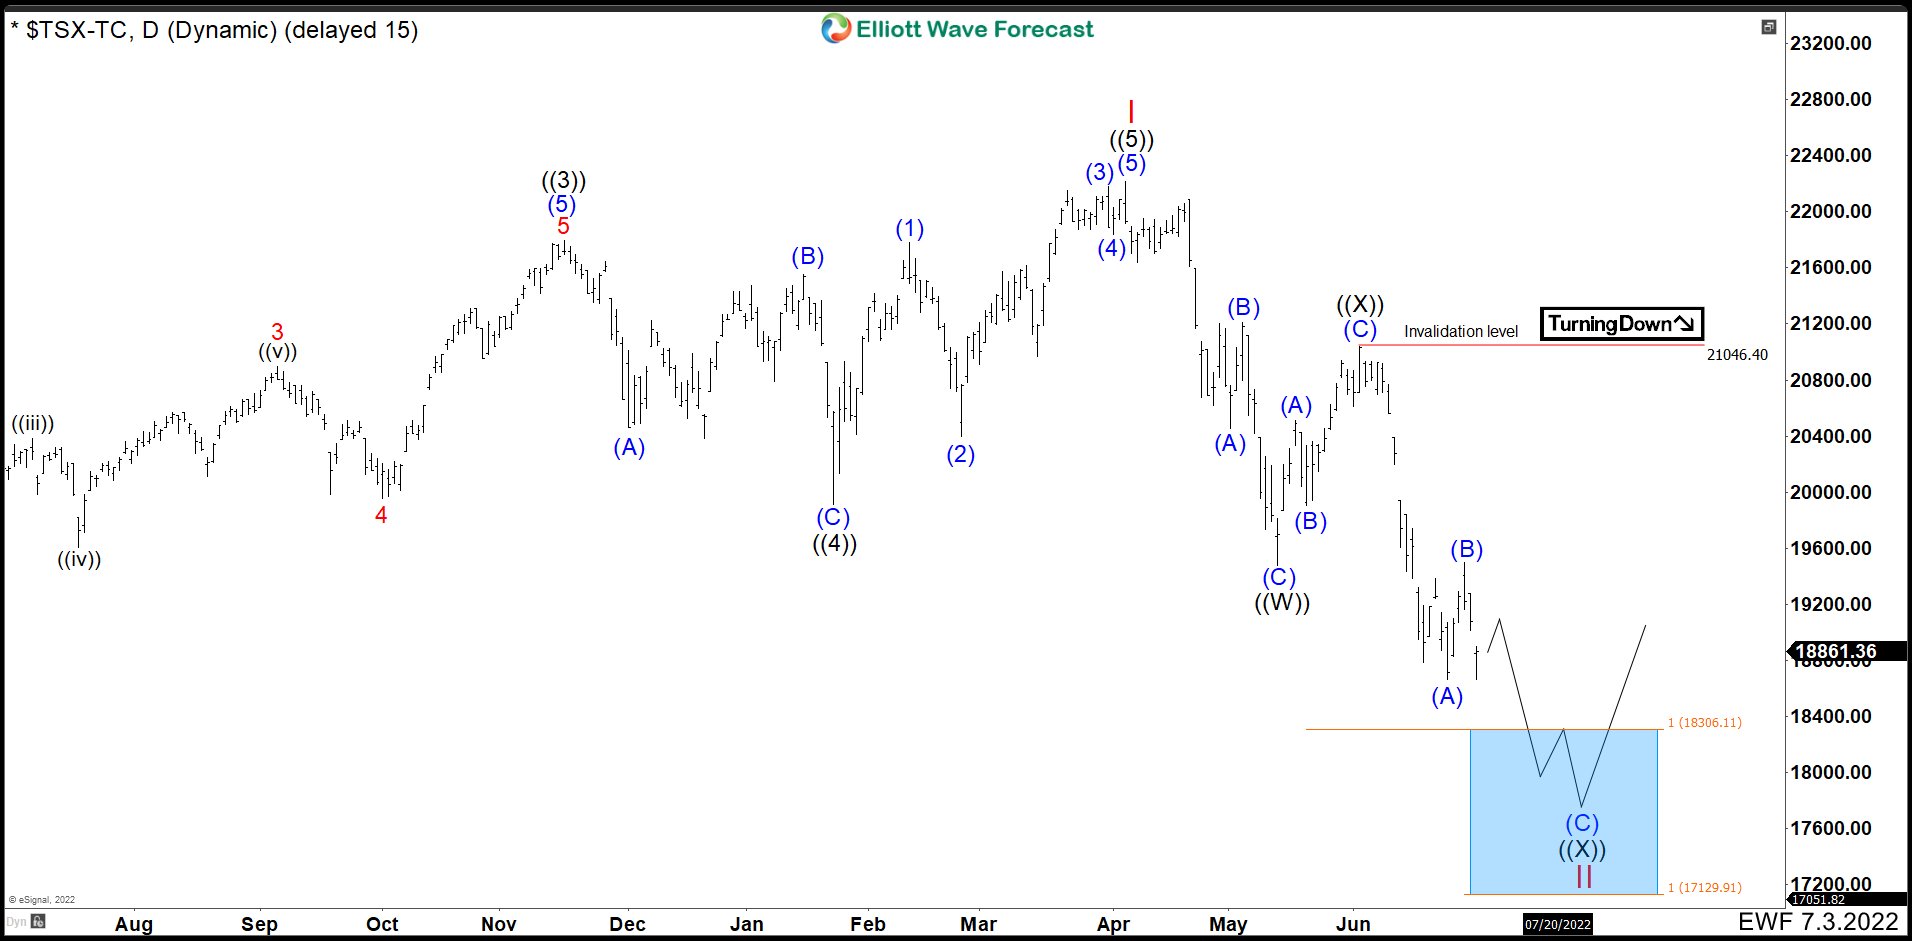
TSX Daily Chart July 1rt 2022
Last update, we were in the last swing to complete a double correction. We expected to bounce in the ideal zone to end the cycle given in 18306 – 17129 area. From here, we expected to continue with the rally that breaks 22219 peak or see 3 swings upwards at least.
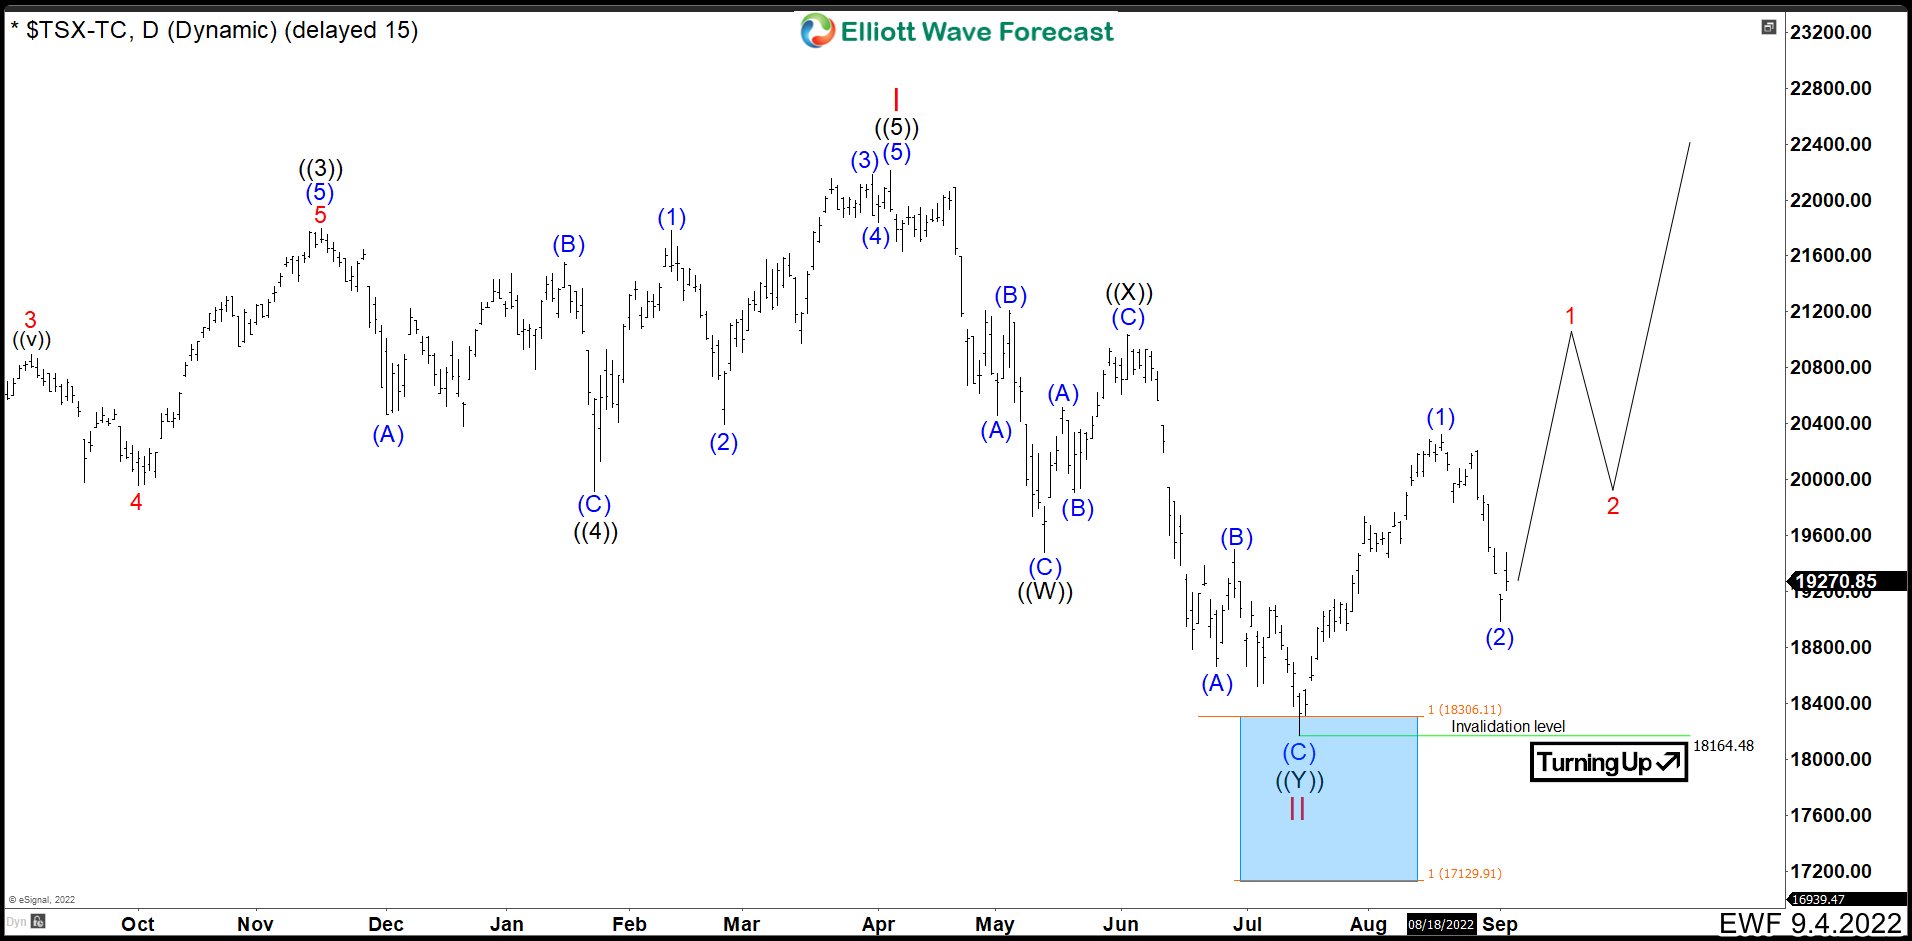
TSX Daily Chart September 2nd 2022 ALT 1
After two months, the index bounded strongly after hitting the blue box. Now with this information, we can determine 3 paths to follow in medium or long term. The first one, this is just continuing to the upside to break the 22219 peak as long as we are above 18164.
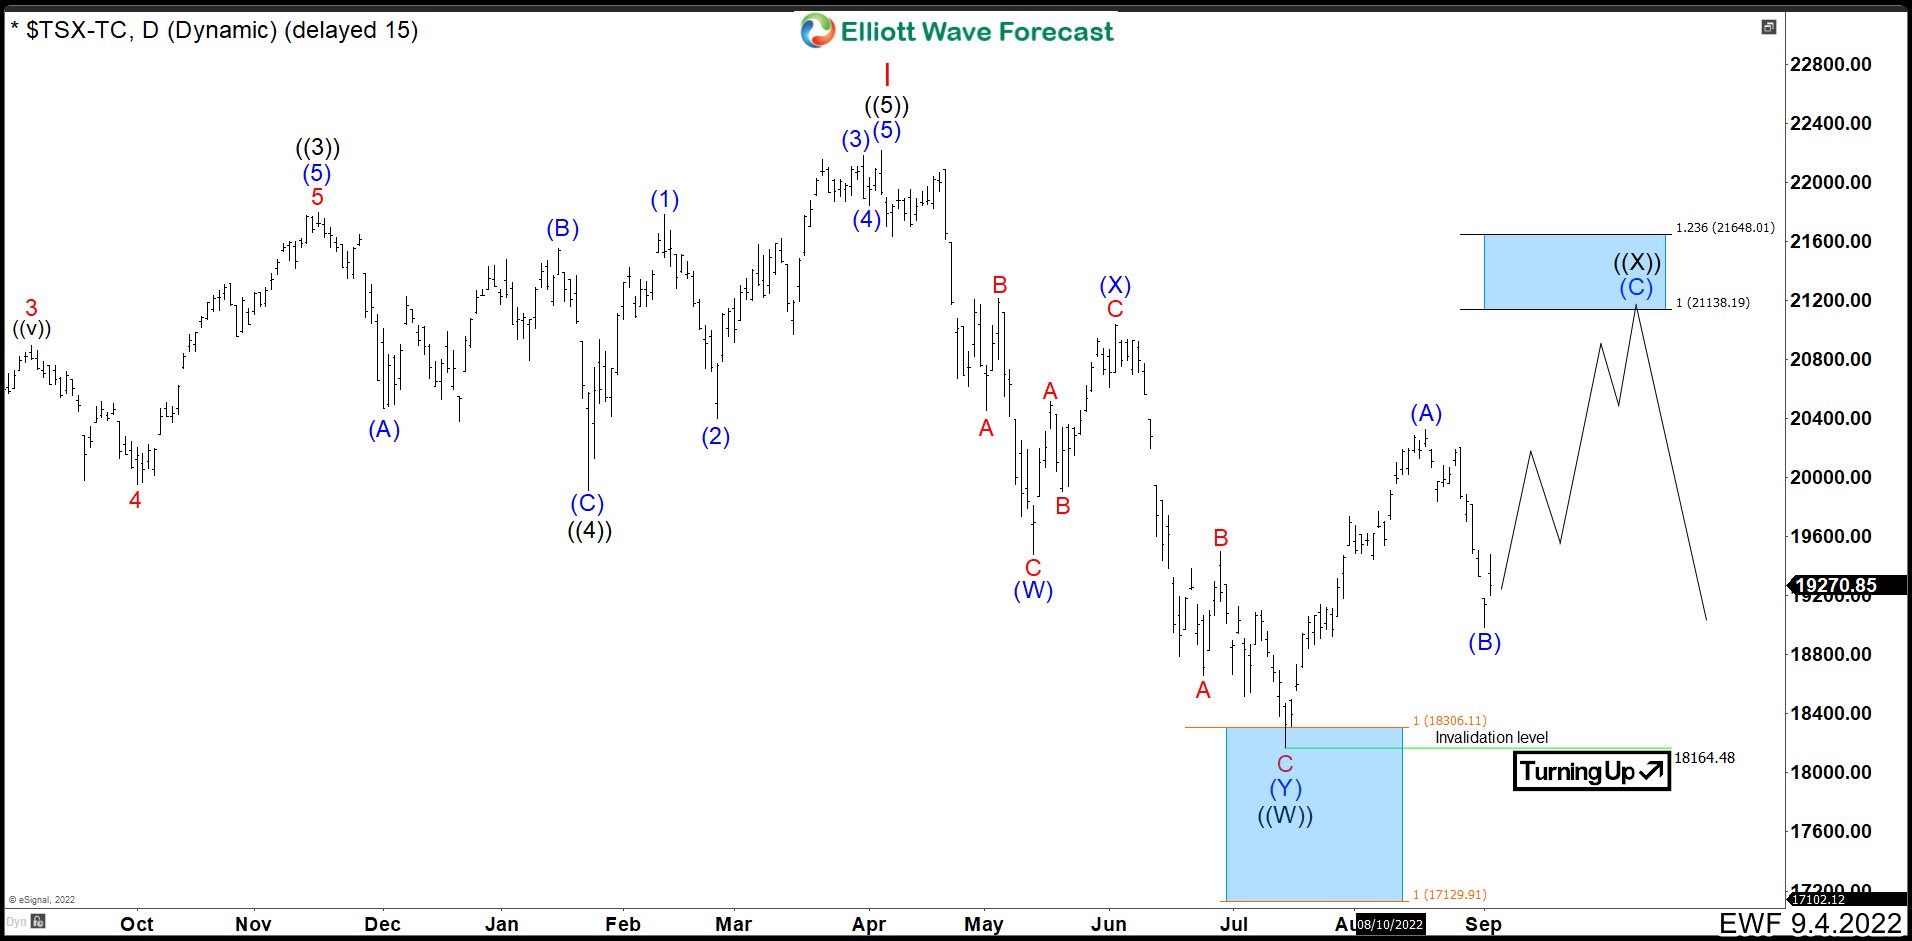
TSX Daily Chart September 2nd 2022 ALT 2
The second is to complete 3 swings up at least. This means that wave (A) and (B) are over and we should make a bullish impulse higher until reaching the 21138 – 21648 area. Here the market should be rejected to continue the downtrend and break 18164. (If you want to learn more about Elliott Wave Theory, please follow these links: Elliott Wave Education and Elliott Wave Theory).
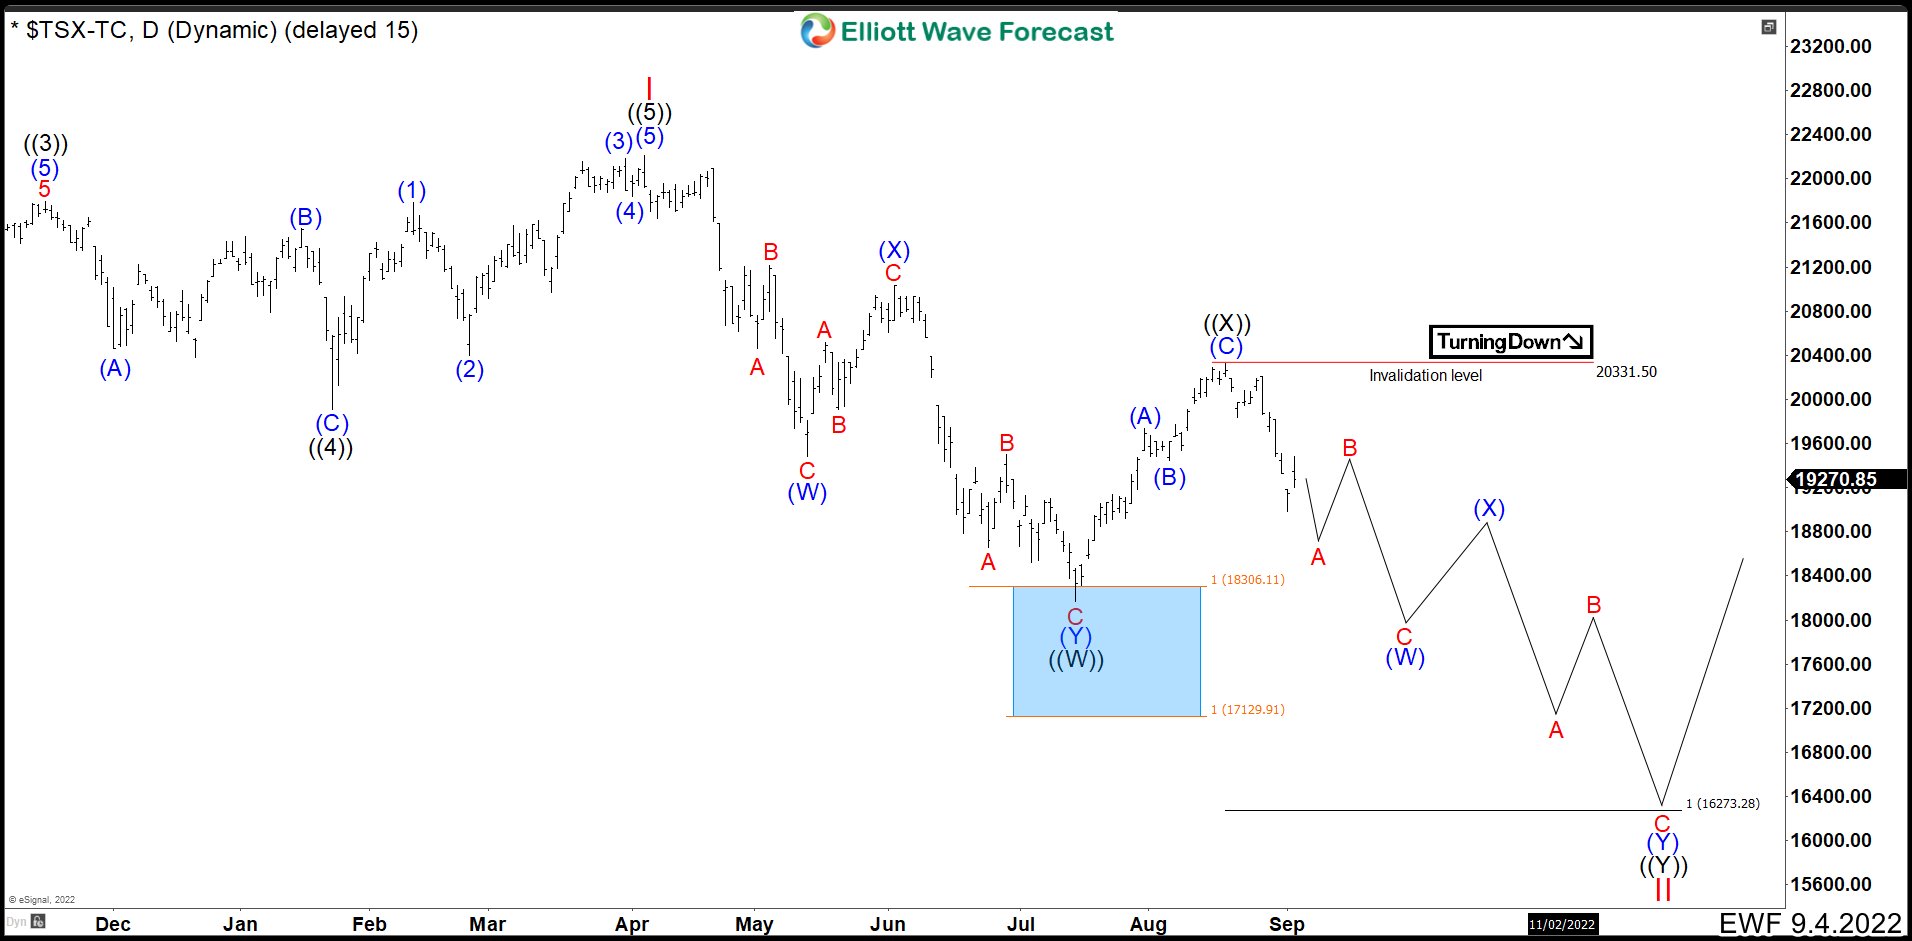
TSX Daily Chart September 2nd 2022 ALT 3
The last alternative shows us the possibility that the 3 swings higher have already ended and that we would only continue with the downward trend. This is doing a double correction to break the low 18164 while we are below 20331.
The key here is to determine which level is going to break first. If 20331 breaks, then we would be within the first two alternatives. If 18164 breaks first then we are in the third alternative. So, this September will be very important for the rest of the year and next.


