Cloud computing is one of the sectors that has really taken the spot light since COVID-19 hit the world by storm. This sector has vastly outperformed the marketplace since the March 2020 low. Twilio is in the cloud communications business and has had an extremely impressive rally since March 2020 low. It is a a cloud communications platform as a service company based in San Francisco, California. Twilio allows software developers to programmatically make and receive phone calls, send and receive text messages, and perform other communication functions using its web service APIs.
Cloud computing is one of the sectors that the marketplace has made clear will benefit in the future Corona Virus world we now live in. TWLO is counting clean off the 2017 all time low low, lets take a look at the Daily chart below and then we’ll get into the shorter term 4H chart.
Twilio Daily Elliott Wave View:
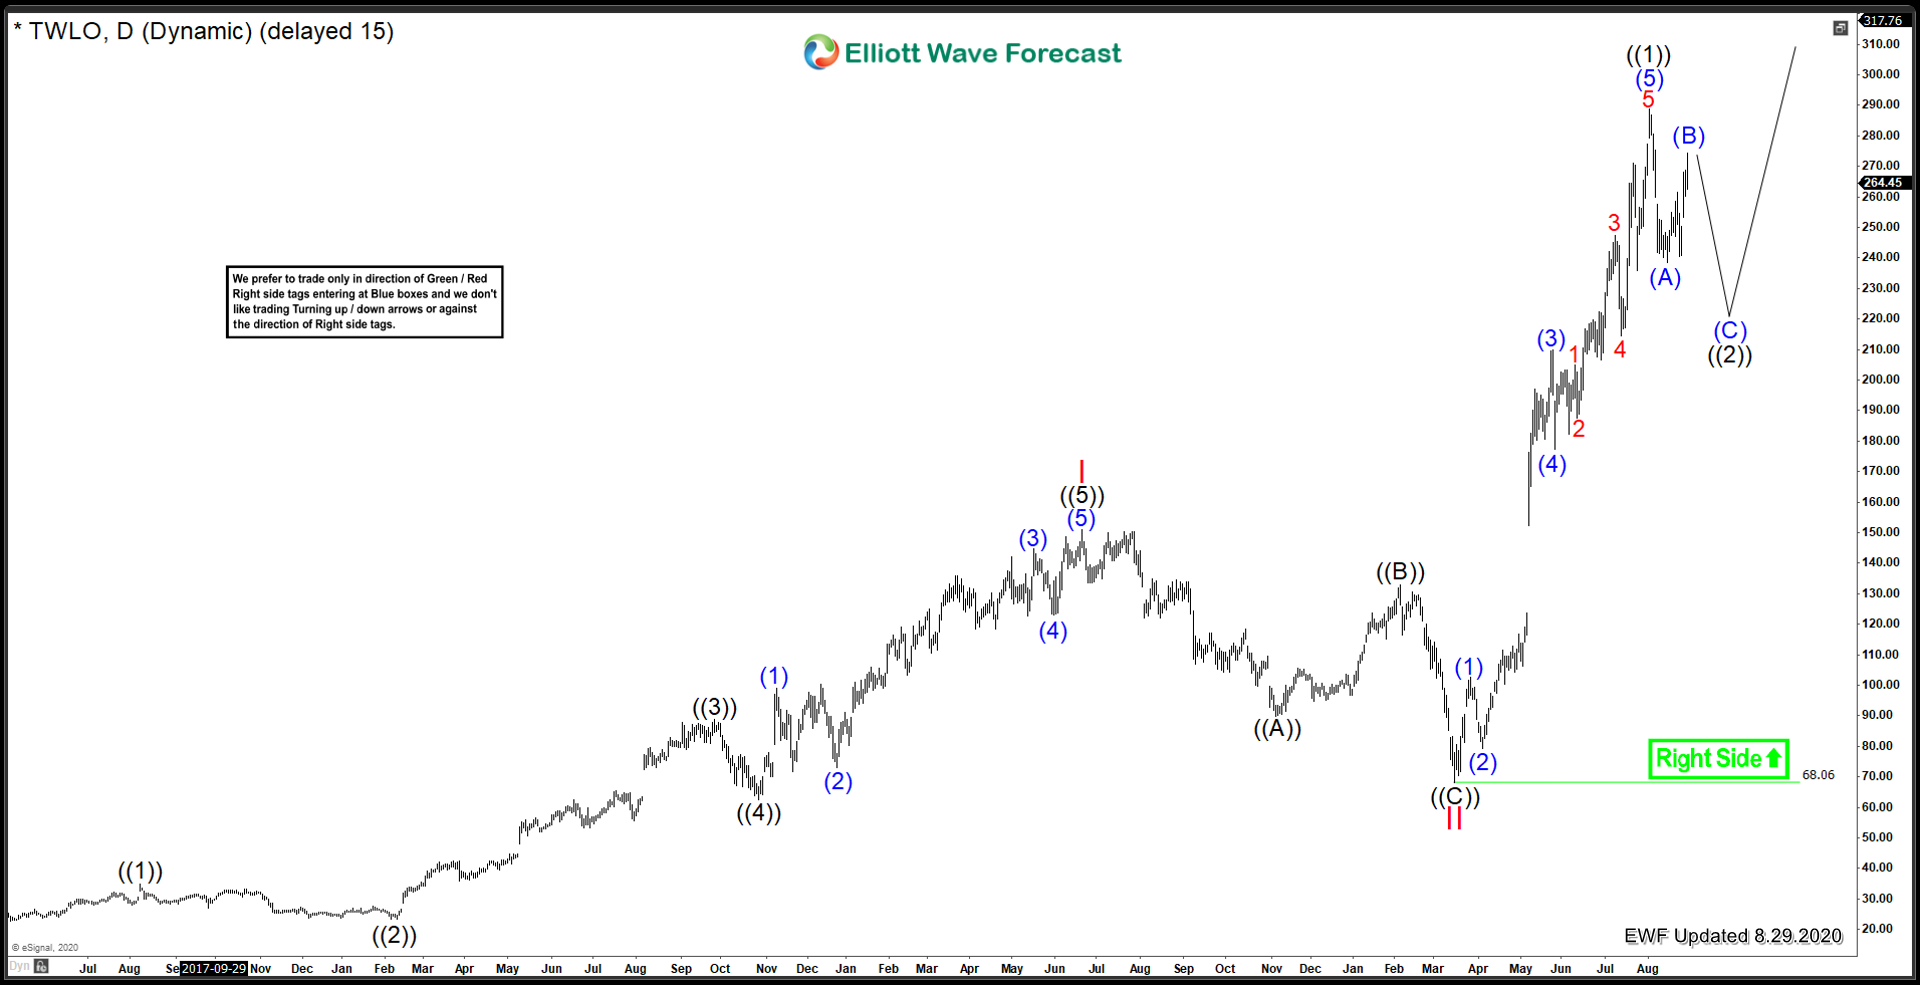
On a Daily Time Frame. From the 2017 lows, Twilio has a great looking structure that favours further extension higher in the future. Off the 2017 low of 22.80, I am favouring a nesting setup for the time being. From May 2017 to June 2019 Twilio has a technically clean 5 waves up for Red I. After that, Twilio corrected that cycle in Red II, for around 9 months into the March 2020 low. From that March 2020 low of 68.06, that market has clearly rallied impulsively into the recent peak posted on August 4, 2020.
It is currently in progress of correcting the cycle from March 2020 low. This correction can unfold in 3, 7 or 11 swings before moving higher. Presently, it appears to be correcting in 3 waves down, but this can evolve over time if the market wants to correct this name deeper in time and price, in 7 or 11 swings. Lets take a look at the 4H more detailed view from the March 2020 low.
Twilio 4H Elliott Wave View:
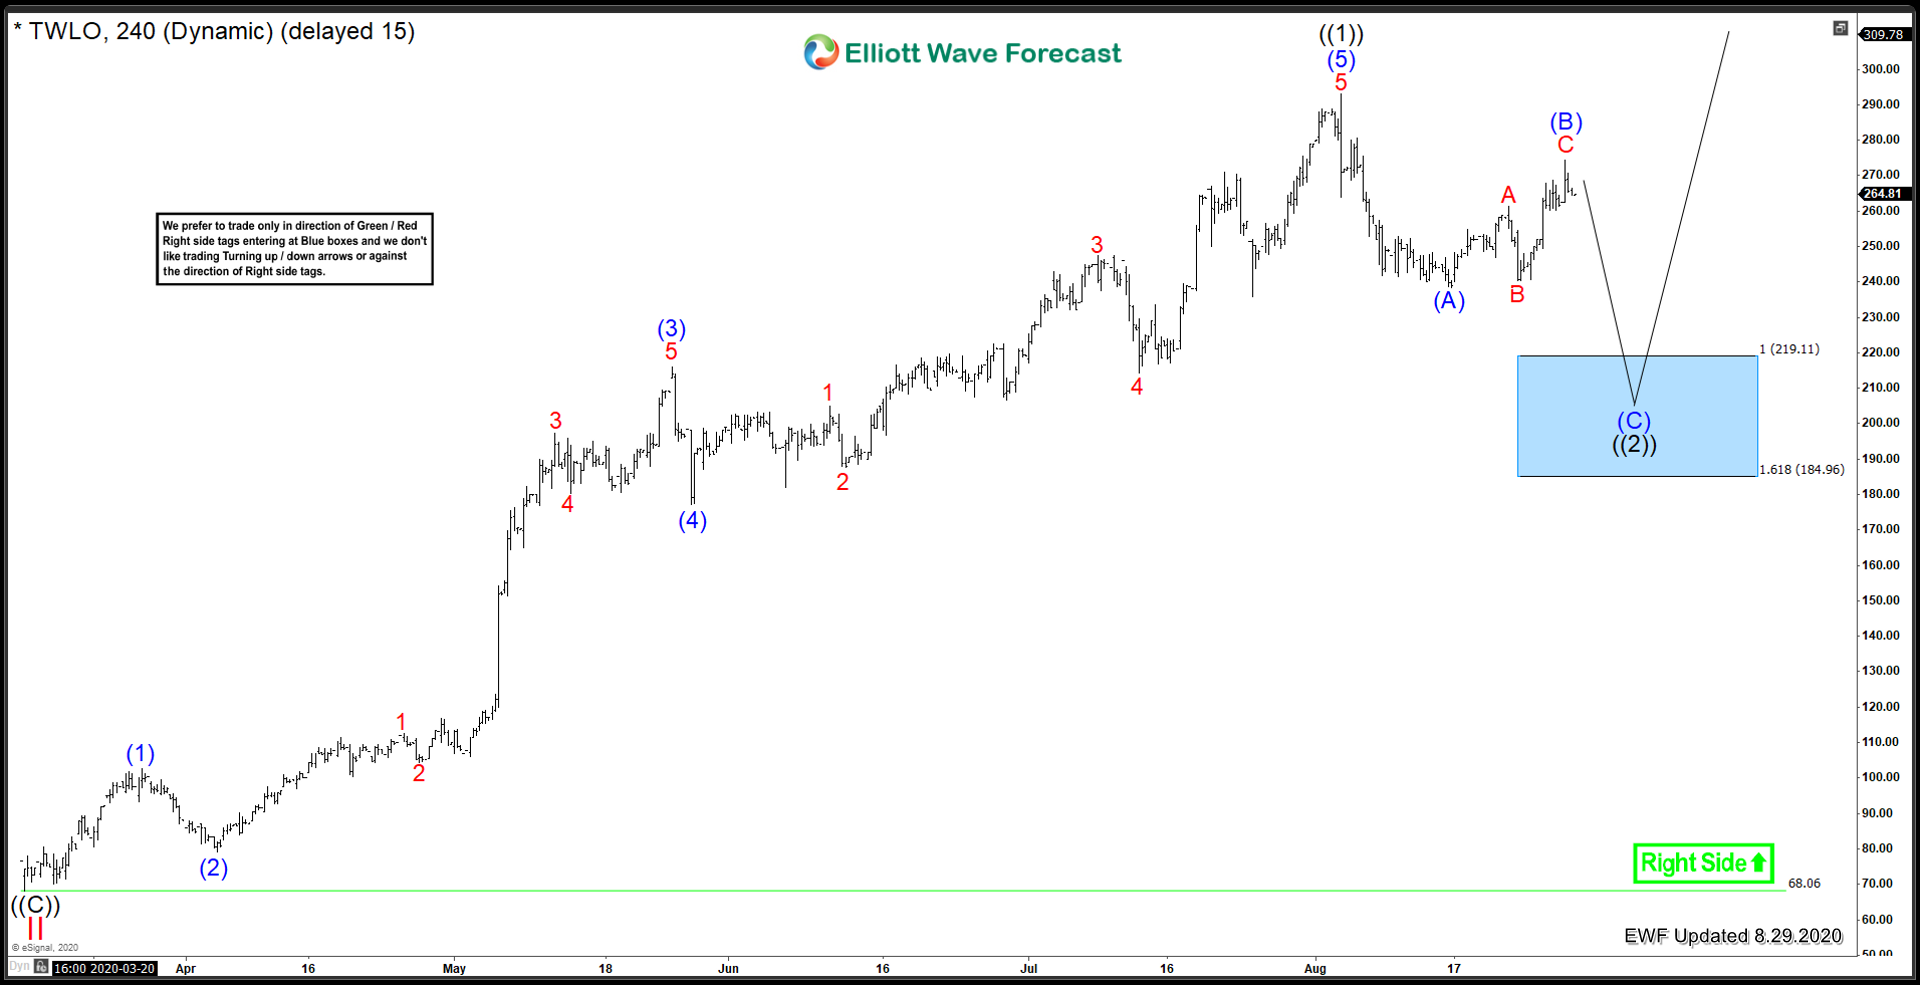
Medium term term view from 3/16/2020 lows of 68.06. Blue (1) is set at 102.69 on 3/26/2020 and blue (2) at 79.25 on 4/03/2020. After that, an extended blue (3) took place, which topped on 5/26/2020 at 216.00. After that, blue (5) rallied to a black ((1)) high at 293.00 on 8/04/2020 Currently, the wave down from that peak has the characteristics of 5 swings down, including an RSI divergence at blue (A) low. The instrument is now bouncing in 3 waves and is favoured to be peaked for (B) recently on 8/28/2020.
There is a blue box extreme area where buyers may show up for a bounce in 3 waves at least. This runs from 219.11 to 184.96. As mentioned above, if the market wants to do 7 swings down instead of 3, this blue box may only bounce in 3 waves. This would be followed by another leg down to lower lows to complete the correction.
In conclusion, Black ((1)) is favoured to be set. The blue box price area may change if (B) manages to post more highs. But regardless, it is still favoured to have another leg down in © before heading higher.