The U.S. Dollar has held resistance at a key spot while building a bull flag formation. The driver to how that resolves will likely have some drive from tomorrow’s Core PCE data, which is the last inflation print before the FOMC rate decision next Wednesday.
By :James Stanley, Sr. Strategist
U.S. Dollar Talking Points:
- There’s a couple of different technical items around the USD at the moment. From the daily chart, there’s a bull flag formation with support showing at a Fibonacci level. But, from the weekly, the U.S. Dollar is threatening an evening star formation after last week’s spinning top has been followed by a pullback of the early-April breakout. Tomorrow’s USD performance is important for continued development.
- The major data release on this week’s docket is tomorrow’s Core PCE print. This is often called the Fed’s ‘preferred inflation gauge’ and it was instrumental in their dovish outlay earlier in the year. This will be the last piece of inflation data ahead of next Wednesday’s FOMC rate decision, and it’s been more friendly to the Fed’s dovish push so far this year than what’s shown in Core CPI.
- I’ll be discussing these themes in-depth in the weekly webinar. It’s free for all to register: Click here to register.
Click the website link below to get our exclusive Guide to central banks and interest rates in 2024.
https://www.forex.com/en-us/market-outlook/

It’s been a strong start to 2024 for the U.S. Dollar and the major driver behind the theme has been continued strength in the U.S. economy. Even with the Fed retaining a dovish posture at the March rate decision, highlighting the potential for three rate cuts this year, the USD has continued to charge-higher as inflation data has largely remained above-expectations and the labor market has continued to show strength through NFP reports.
There is a fundamental item that I’ll get to later but, for now, the technical backdrop behind the USD remains of interest as tomorrow’s outing could be telling for follow-through price action.
From the daily chart, there’s a bull flag formation as the pullback from last week’s highs has remained orderly. The low for today in DXY has come in at a Fibonacci level of note, the same 105.51 that I had highlighted in the Tuesday webinar. The bull flag is often approached with aim of bullish continuation, and this would expose the resistance zone sitting above price that stalled the move last week; and that runs from 106.50 up to 106.88, as this was the gap produced from the November FOMC rate decision when the bank started to sound very dovish.
U.S. Dollar Daily Price Chart
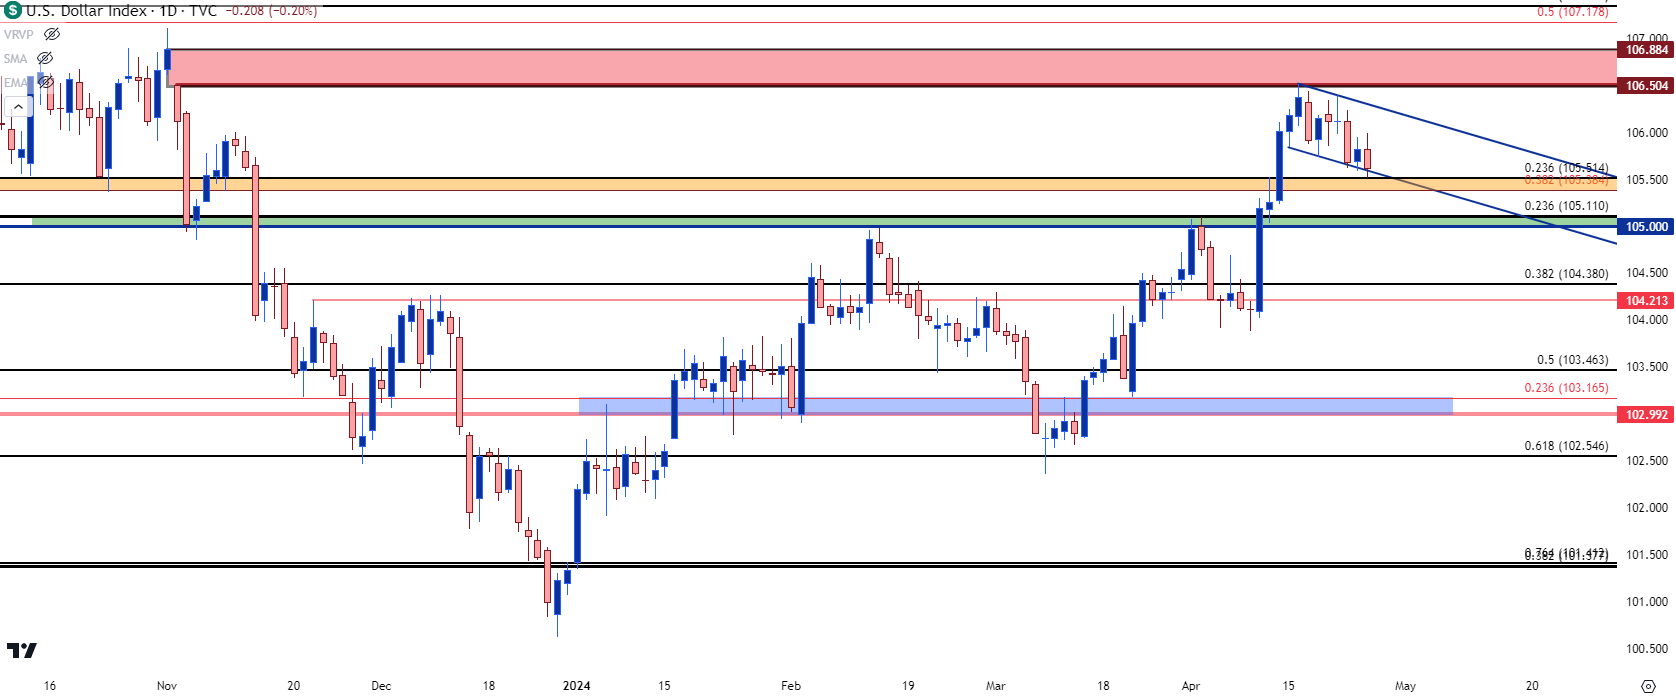
Chart prepared by James Stanley; data derived from Tradingview
U.S. Dollar Weekly Chart
Taking a step back to the weekly chart, and the same range that’s been in-play for 15 months remains of consideration. The high from last week is very near range resistance and, so far, that’s stalled the bullish run. As I had highlighted last week, the U.S. Dollar had flashed overbought conditions on the daily chart which isn’t all too common, and that’s further reinforced the pullback theme that’s built-in that bull flag looked at above.
But, if buyers fail to hold the lows we may soon be looking at a very different picture, and it ties directly back to the fight against inflation as tomorrow’s Core PCE data could have a large bearing on how this plays out.
From the weekly chart, taking last week’s indecision which showed as a spinning top, bearish follow-through this week could produce an evening star formation and that’s often approached in the exact opposite manner of the bull flag above. Evening stars are usually looked at as ‘topping’ formation, and it’s a three-bar sequence looking for A) a strong upside move followed by B) indecision, followed by C) a retracement of at least 50% of A.
That shows around 104.99 by my calculation, so if we see tomorrow’s DXY bar close below that level, the bull flag would be negated, and the evening star would be confirmed. But, for that to happen, we would likely need to see a Core PCE print come below expectations.
Otherwise, the current zone of support could function as a higher-low as bulls drive into that November gap, and even a bit lower, from around 104.77-105.00, there’s continued higher-low support potential.
U.S. Dollar Weekly Price Chart
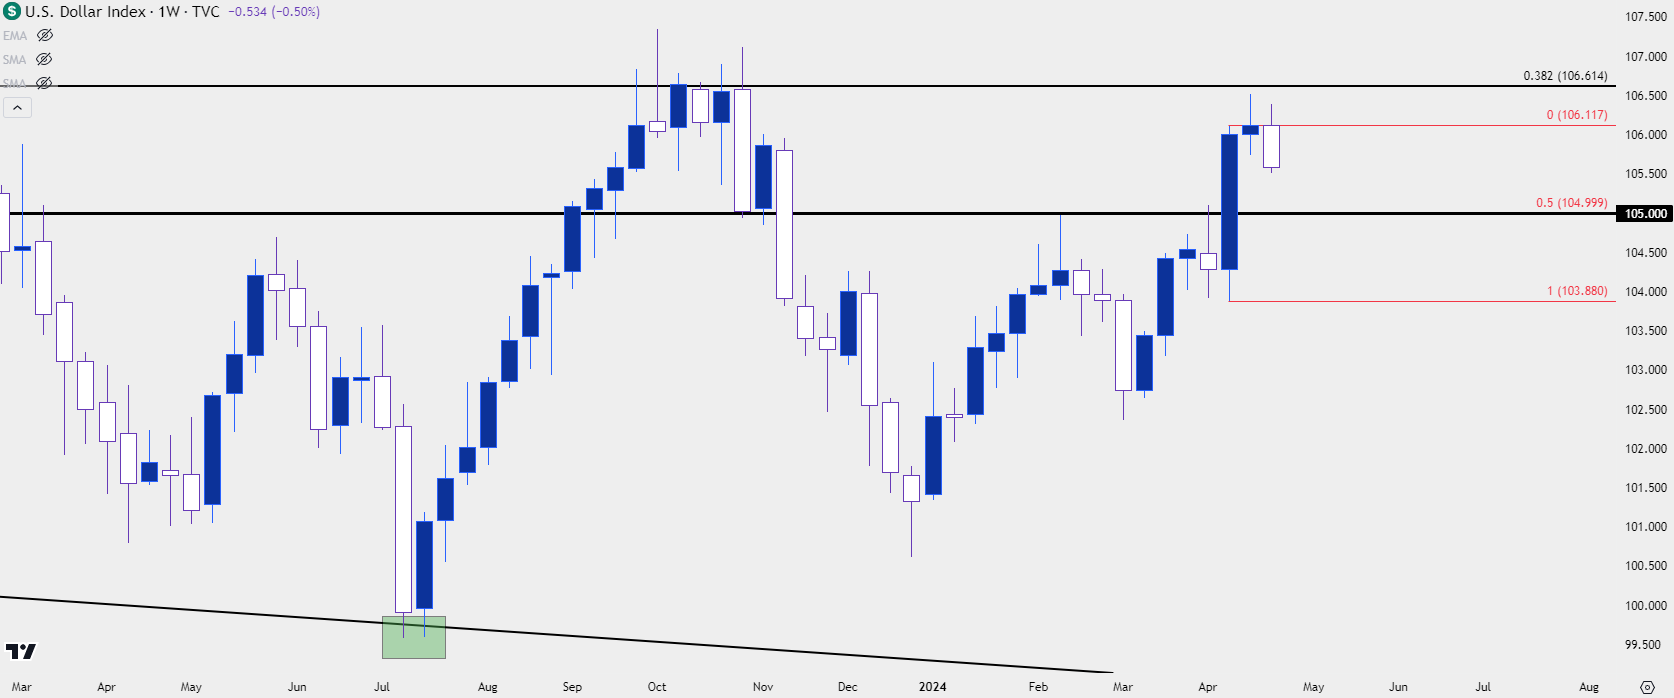
Chart prepared by James Stanley; data derived from Tradingview
The Core PCE Driver
This is something that can have wide-ranging connotations. The Fed’s fight against inflation has been a key driver in markets and the boost that was seen in stocks last Q4 was very much emanating from a dovish lean at the FOMC. That helped to soothe rates which in-turn drove stocks, and that pushed-down the U.S. Dollar after a strong bullish run last summer.
The Fed’s argument for rate cuts has grown opaquer, however, as inflation data has started to show signs of entrenchment while the labor market has remained strong. The unemployment rate has remained below 4% for the longest stretch since the Vietnam war, and Core CPI has now printed within a 0.2% band of 4% for seven consecutive months; both of which suggest the Fed should probably be looking at hikes rather than cuts.
But as discussed in these articles, CPI isn’t the only measure of inflation in the U.S. and the Fed’s ‘preferred inflation gauge’ of Core PCE has been a bit more encouraging until the past couple of months. This data point was falling fast last year but has started to show similar signs of entrenchment over the past few months.
That’s at least partly what’s compelled Fed-speakers to take a step back from commentary regarding rate cuts and, in-turn, we’ve seen Treasury yields jump higher and that’s added some strain to stocks. And so far in Q2, stocks are showing a very different outlay than what we saw in Q1, very similar to what I had discussed in the Q2 trading forecast for equities, which you can access from the link below:
Click the website link below to get our exclusive Guide to index trading in 2024.
https://www.forex.com/en-us/market-outlook/

For tomorrow, the expectation for Core PCE is to come in at 2.6%, and if that prints, it would be a sign that inflation continues to cool per that data point and that can keep probabilities of rate cuts this year on the table. But – if it beats, and prints at 2.8% or higher, there could be a fast re-shuffling of those rate expectations and that could lead to more USD strength, higher yields and possibly even more pressure in equities.
Core PCE (orange) and Core CPI (blue) Since January, 2021

Chart prepared by James Stanley
— written by James Stanley, Senior Strategist
The information on this web site is not targeted at the general public of any particular country. It is not intended for distribution to residents in any country where such distribution or use would contravene any local law or regulatory requirement. The information and opinions in this report are for general information use only and are not intended as an offer or solicitation with respect to the purchase or sale of any currency or CFD contract. All opinions and information contained in this report are subject to change without notice. This report has been prepared without regard to the specific investment objectives, financial situation and needs of any particular recipient. Any references to historical price movements or levels is informational based on our analysis and we do not represent or warranty that any such movements or levels are likely to reoccur in the future. While the information contained herein was obtained from sources believed to be reliable, author does not guarantee its accuracy or completeness, nor does author assume any liability for any direct, indirect or consequential loss that may result from the reliance by any person upon any such information or opinions.
Futures, Options on Futures, Foreign Exchange and other leveraged products involves significant risk of loss and is not suitable for all investors. Losses can exceed your deposits. Increasing leverage increases risk. Spot Gold and Silver contracts are not subject to regulation under the U.S. Commodity Exchange Act. Contracts for Difference (CFDs) are not available for US residents. Before deciding to trade forex, commodity futures, or digital assets, you should carefully consider your financial objectives, level of experience and risk appetite. Any opinions, news, research, analyses, prices or other information contained herein is intended as general information about the subject matter covered and is provided with the understanding that we do not provide any investment, legal, or tax advice. You should consult with appropriate counsel or other advisors on all investment, legal, or tax matters. References to FOREX.com or GAIN Capital refer to StoneX Group Inc. and its subsidiaries. Please read Characteristics and Risks of Standardized Options.