UMS Live

Ah that’s great thanks. I had read about contacting him to get extended demo time but had forgotten where I read it.

I was just getting into a routine of sticking precisely to the rules when my demo ran out. I am keen to see how things would have worked out if I had continued!

Still though, if anyone can let me know how their trades are going whilst using this method I would be most greatful.

Yer its well worth it. His direct email is <[email protected]> if that helps.

There are a few ways of dealing with this.

Firstly, with a very long upper wick, you could place the PCI halfway up the wick instead of the traditional place.

Secondly, if you are using the starc bands, and you think you are entering near the extreme, then if the trade continues to go against you, you could consider a definite exit after another 10 pips.

The problem with answering this question, [B]Drav[/B], is that I do not know which level you are trading.

[B]If I knew this, I could give you an exact solution to your problem.[/B]

Congratulations to [B]Turtleboy [/B]for getting in there and making a successful trade, even if the method is a little un-orthodox.

Cheers for the replies Tymen, I am trading the 30min charts with 5 min + keltner band for entries and exits.

My trades yesterday, entries in yellow, exits in blue:

10 pips or so…

The second I entered as soon as it broke the 50 support level, and rode it all the way down hoping to break the 00. It stopped short and the 5 min chart was showing signs of a retrce and I am a wussy so pulled out with 35 pips.

This is a good example of what I was talking about earlier tho. The second chart shows that on this upward trend, basically we are waiting for GBP to become oversold in the short term, then jumping in on the retracements to catch the ride down, as it if never crosses the lower BB, we never trade long?

Or am I missing something? :slight_smile:

As for your question Cordite, I’ve only been using this concept for a week so couldnt really say. I’ll get back to you after a month or so :slight_smile:

To [B]Drav [/B]:

OK, let me give you some straight answers.

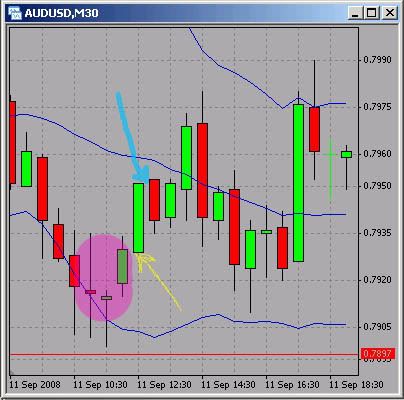
In the first chart, the morning star was fragmented with the BB in breakout mode.
Not the best choice for trading - you were fortunate!
Only you know why you exited after first candle??? :confused:

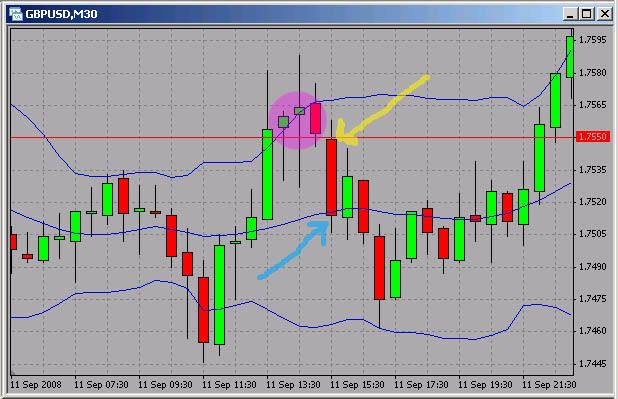
Now the second chart :

The second chart shows that on this upward trend, basically we are waiting for GBP to become oversold in the short term, …

Try to avoid such statements which refer to indicator trading and are meaningless when we deal with candlesticks.

What we are doing is trading an evening star which means to go short.

Now again, unfortunately, you have chosen a poor example.
The red candle length must be long enough to be nearly 50% of the length of the 1st green candle.
Upper wicks on this red candles should be at a minimum.
This is not a quality choice of pattern and again you are fortunate because the BB is level at the red candle this time.

There is no support level present at the 50 mark at all.

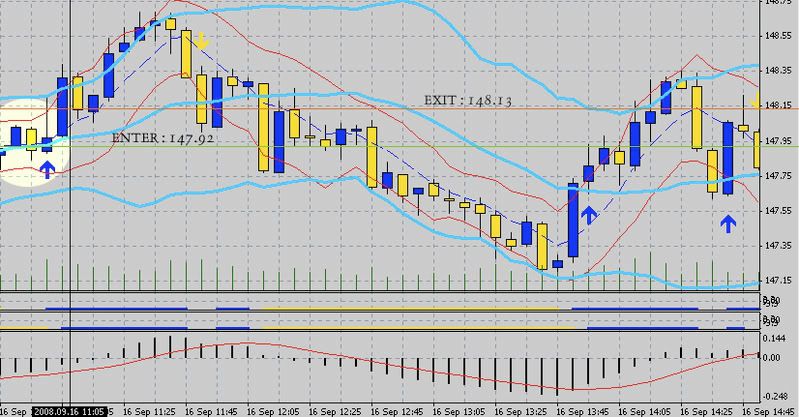
…and the 5 min chart was showing signs of a retrce and I am a wussy so pulled out with 35 pips.

No wussy here - you did the correct thing!
If you hit the starc extreme exit point then this level says that it is time to exit and wait for the next starc extreme entry point.

Had you re-entered at such a point, your 30 minute chart shows that you could have gone right thro to the lower BB.

You have not shown your 5 min chart so I cannot discuss that without seeing it.

In summary, 35 pips is still a very good trade! :slight_smile:

Compare this to the Rumpled One’s “[B]Never Loose Again[/B]” thread where the traders are fighting to get 5 pips, and even losing that!! :eek:

I am sure you got that 35 pips with relative ease. :slight_smile:
Note that in many of the threads on this forum, to get 35 pips in one shot is difficult!!

Finally, my counsel after looking at your charts.

[B]It is the same one I keep repeating - go for quality patterns!![/B]

Tymen, Thanks for keeping me on track! I appreciate it. I’ll stick with the rules!

I usually trade the 3 green soldiers/red crows, but it always feels like a gamble. The price has already gone a long distance in one direction, often along the extreme BB. I don’t trust them enough to trade them on my live account yet. You said something about them being a special case that you would discuss later, so I’m wondering if there are conditions when you would [B]not [/B]trade 3 green soldiers/red crows?

Thanks!

As you know I have been trading the system ( I havn’t been posting the 5 min charts, but I AM using it for entry points) Anywhoo, My question is:

Do you think that the higher time frames (30min and above) provide better signals, and are ideal for a 30 pip S/L ?

The question comes from me trading last night on Dealbook (which I set up on my pc finally) and having access to the full gamut of trading periods 20,25,30 etc I scalped more and more on those periods (20 min ,25 min ). the more I traded the more I found that my stop losses were hit more often. Is this a product of ‘Quality trades’ or the lack therof? Or, are higher time frames 30min + better suited for this method. Thank you.

Not seeing any charts I can only give you a general answer.

The stop loss is [U]not arbitary[/U], there is a specific setting for it.
The setting comes from trader experience - it is not my setting or invention.

This setting is to put the stop loss 3 pips further out from the extreme candle wick of the pattern you are trading.

eg…evening star…stop loss 3 pips above the star wick. (PCI stop loss)
Piercing pattern…stop loss 3 pips below the green candle lower wick. (This wick should be the lowest). (PCI stop loss).

In a quality pattern, the Bollinger will not be showing breakout mode, either in long trading (many green candles) or in short trading (many red candles).

In that case, it is expected that the retrace, if any, will [U]not [/U]hit your PCI stop loss.
On the other hand, if your BB is showing a breakout (rising or falling very sharply), then you can be almost certain that your PCI stop loss will be hit.

[U]The timeframe has nothing to do with it.[/U]
In both higher and lower timeframes, there may be retraces.
And there may not be.

If you keep hitting your PCI stop loss after placing it as recommended, please post some charts, then we can all look at them and analyse the problem and work out the solution.

For those that have contacted Kinetic Securities to ask them to extend your demo, how long did it take for them to get back to you? I’m eager to resume the testing, but am yet to hear from them. :frowning:

I’m keen to try my new risk/reward system (sorry if this isn’t new to anyone) where I have a different pip value depending on where I am in the trade.

ie,

At my initial entry (after I see a valid pattern and determine the best entry point) I will have the 10 pip stoploss (not PCI - manually triggered and watching for a retrace) where 10 pips will equal 2% of my capital.

Should I make 10 pips or more gain from the entry trade, I will call it a day and do no more trading for the day, as I will have met my 2% per day money management target.

If though, the price retraces so I lose those 10 pips and am forced to exit, then when I re-enter I will calculate how many pips to the PCI stoploss and base my next 2% on those amount of pips. This will stop me from losing potentially 15-20% (as has happened) on one trade, which of course I’m not willing to do. I will then recalculate that 2% every time I renenter the trade based on how far to the PCI.

If this was already what people were doing then I’m glad to have finally caught up, if not then heh, it should work for me and protect me from big losses (I hope).

I need a couple more months of testing to fine tune this before I’m ready to go live. But something was always bothering me about my risk/reward ratios and then at 3am it finally hit me - I was risking far too much at any one time on the starc band trades compared to the initial entry trade as I wasn’t recalculating that 2% risk! Thanks goodness for demo trading, eh? :wink:

This will mean that although the starc band trades will potentially make less, they will at least be safer - and in my humble mind this system is a combination of two separate systems. The initial entry with trade after the pattern, then the starc band trades using the extremes. I’ll be treating them as separate entities and seeing how that turns out.

I hope that makes sense, if not I’ll repost.

But aye, any help with kinetic securities would be most appreciated :smiley:

Cord

Tymen has just posted in the main thread saying he’s going to be revising the entry methods and doing away with the initial keltner channel entry trade - seems to fit in nicely with my thoughts there, so look forward to hear what he has to say.

Cord

To [B]Cordite [/B]:

Try phoning Jay at Kinetic.

Look up the website and grab the international phone number.
Of course you will have to adjust your time to contact him during business hours.
If you can speak to him directly, he can extend the demo while you are on the phone.

A nice money management strategy you have worked out with your stop loss. :slight_smile: :slight_smile:
I take it you are using the Basic level.

But you may want to leave it altogether when you see what is in store with the improved Intermediate and Advanced levels.

I was using the advanced level to be honest, heh. They still included a keltner entry coupled with starc bands, or at least that was my impression of them. :slight_smile:

Method :

  1. Set a PCI stop loss 3 pips higher/lower than the extreme wick of the pattern.
    No rush here � as long as it is done before you enter the trade.

  2. Open the 5 minute Keltner chart and use the Keltner entry method to obtain the best entry.
    Enter 2 amounts clicking the Direct Deal ticket. (DDT).

3A) Pips first.
Switch to watching the 5 minute Starc chart.
Close both amounts with DDT when price action hits the relevant Starc exit point.

OR

3B) Retrace first.
Switch to watching the 5 minute Starc chart.
If the price action goes negative, then close both amounts at -10 pips.
Total loss is -20 pips.

  1. Re-enter 2 amounts when the price action hits the relevant Starc retrace point.

  2. Exit the 2 amounts when the price action hits the relevant Starc exit point.

Repeat steps 4 and 5 until the price action on the main chart starts to reverse or the candles are too far away from the pattern.

END.

This was what I was following. I just wasn’t recalculating pip value in relation to my 2% risk/distance to stop loss. It was this error I was looking forward to correcting, together with not treating “2 amounts” as two lots of 2% risk, but rather changing that to 1 amount of 2% risk only.

For me, the distance between the stoploss once using starc bands is a little high (ie, at the top of the wick), and it was this distance I was looking to tweak with testing.

What made you think I was using the basic level? I’m curious now. :wink:

Cord

Tymen,
Sorry to quote myself! But I am looking forward to your comments on this. It seems to have been overlooked when I first posted it.

Thanks.

For me to understand where your troubles are, I really need to see a sample trade ie main chart plus 5 min chart and explanation (preferably on the chart) of what you did.

If your sample is one of the 4 majors, I can look it up myself if you give full details.

I cannot understand your problem by mere description. There appears to be something wrong here.

With the Advanced level, the retrace extreme should be fairly close to the PCI so the pip distance should be small.

I thought you were using the Basic method because the pip distance from the standard entry to the PCI can be large sometimes.
And that seemed to fit your description.

I am most keen to look at a full chart sample to rectify your issue.
If you give details, I can use my Dealbook - save chart posting.

If calling isn’t convenient for you:
I sent an email to Terry Narloch at GFT, mentioning that I am studying Forex online with Tymen (Thanks, Tymen!). My demo was extended for 2 months within 24 hours. Email: tnarloch at gftforex.com

Tymen:

It’s not the distance between the stop and the entry that was the problem. I think I have given you the wrong impression of what I was commenting on.

The problem I had, and one that I have rectified now, was that I was using a calculation where 10 pips = my 2% risk. This worked fine with the initial entry where I would be manually exiting at 10 pips loss. However, on the starc entry anything more than a 10 pip loss was resulting in me losing more than my allocated 2%.

So, I just realised that I needed to recalculate my 2% risk based on the distance between the starc entry and the stoploss above the wick. The distance itself was never a problem, but my risk/reward was. Even 12 pips between the stoploss/entry was above my allocated risk level - but it’s fixed now.

So, as you can see, it’s not a problem with the charts, patterns or the system - so it’s not anything I can demonstrate to you :slight_smile:

However, now I have identified what I was doing (and my subconscious was yelling at me to put it right anyway) there are no more problems :slight_smile:

That’s excellent, thanks Condor - I’ll email now and see if I can get the same good luck you did!

Here is a trade I did last night,Spotted the pattern on the 30min (which I feel more comfortable trading)

30min

and here is the 5min entry chart

5min

I entered at 147.92 and exited at 148.13.
The trade on the 5min went up to 148.40 before there was a significant reversal.

My question is with the S/L and T/P levels. I know that you stated that I should have the bottom of this morning star pattern be my S/L. That would put me at 147.59, And consequently at about a 33-35 pip S/L.

Should my T/P be double that?We know,in retrospect that price DID indeed rise to justify such T/P. But in an active trade, how would one know this or be comfortable with the notion? I have the propensity to escape the trade with a meager 10-15 pips.

Thank You.

The exits are quite subjective, so that some would see a clear exit signal and others would not (in that unlike indicators you’re looking for more of a pattern than an exact signal).

For me, there are two possibilities there.

Either at around …32 or so, where you first see 3 candles “walk” the upper starc or, what I would personally use around …57/58 or so. I would choose that second bunch of three candles are they are more ‘on the starc’ than the first three, which are mainly the wicks.

The trouble with this subjectivity, for me at least, is preventing fear/greed form coming into your mind and telling you to get out/stay in when another time you would do the opposite.

So here one person would make a large profit, another would make a smaller profit, and yet another still would not see an exit there at all and would ride out the pattern for a potential loss…

I hope I’ve helped/am right here - one of the more experienced traders can jump in and put your right if not :smiley: