You are correct Condor, I had my doubts with the smaller body and no newer lows from the the 2nd to last red candle. The trade turned moved 10 pips beyond the 100 WMA (purple line)
I know this question might sound dumb, but basically how do you go about your scanning process thruoughout the day. Beucase most of our time spent will be scanning. I have all the charts up, does anyone use a systematic way to scan each pair say evry 5, 10 or 15 mintues in a certain order or just keep flipping. Like now its 847pm eastern time the dollar seems to be headed down so I am watching the aud/jpy, eur usd, eur jpy and aud usd all going up and looking for a esp to form. So i just keep flipping back and forth and waiting and watchin, i see one almost form and then it goes higher so i wait and watch to see if another forms on same pair or maybe and engulfing or dark cloud. Just thoughts if any one has them, thanks!
Darren
Hey Everybody,
I’ll post here to keep The Joy thread flowing for Tymen.
Thanks guys for the thought, I really appreciate it. (Fx I thought you might have caught a little of Hanna.) It’s going to be a very busy season looks like.
I’ve heard reports back from home (I’m in Miami with the airplanes, we were in Key West Yesterday), Grand Cayman wasn’t damaged, but Little Cayman was. The strongest part of a hurricane is the NE quadrant, and that’s what hit Little. Gustav passed Cayman as a CAT3. It’s already a 4 and will be a VERY strong 5 when it hits the Gulf Coast.
We should all say a prayer for them. Katrina was a CAT3 I think.
Well, we’re going back tomorrow, got lots of shopping done (FX you know what that means;)). Got to drive the Keys and had a pretty good time while everybody back home toughed it out. I feel kind of guilty that I get paid for this.
Hope everybody’s having a good week trading cause I’m missing it.
Hi there,
The following EUR/USD pattern emerged at 22:00 (GMT +1) on the 1st september, 2008.

I entered at the entry point marked, at 1.4606 with 2 amounts.
I exited both amounts at the exit point marked at 1.4596 for an 8 pip gain (with 2 pip spread).
Now, my question is how would you all have handled this? I had to leave the trade early as I had other commitments, but am still keen to fine tune my game plan.
Would you -
[B]a.)[/B] exit both amounts as I did, then wait for a retrace with the starc bands to reenter?
[B]b.)[/B] exit one amount, then reset stop loss to break even with second amount and set a trailing stop of x pips (state value of x). Then await a retrace.
[B]c.)[/B] exit neither amount, reset stop loss to break even with both amounts then set a trailing stop of x pips for both. Then await a retrace.
[B]d.)[/B] exit neither amount, don’t use a trailing stop but watch for a new reversal pattern or a cessation of candles walking the starc on the 5 minute chart and exit both amounts then.
[B]e.)[/B] a combination of all of the above or none of the above (please state).
If I had had the time to follow this trade through properly, I think I would have gone for perhaps a combination of perhaps [B]b[/B] and [B]d[/B], although hindsight makes it kind of hard to say…
Thanks all!
Cord
Cordite,
Nice charts.
I probably would have stayed in that one until the price action started to come away from the starc band. That would show a weakening in momentum.
With that being said, I haven’t had a chance to really study Tymens latest revision.
Cordite,
I like your plan “b”. But I think the whole point of the 4 levels is that everyone can find a way to trade that suits themselves.
Good luck!
Yes, option A for sure !
Then reenter with 1 amount on retrace and let the thing go with a stop at 4610. Set a trailing stop to 12 pips (size of first pips…) and let the thing go.
Hello, I’ve been checking out Tymen’s thread as a way of getting to understand candlesticks better. So I gave it a shot today on the demo system. It was a pretty wild day for trading with the USD going up very strong against almost all other currencies, but I sneaked a couple of trades in when it finally peaked in a decent(ish) fashion!
Here is the 30 min charts, explanation below:
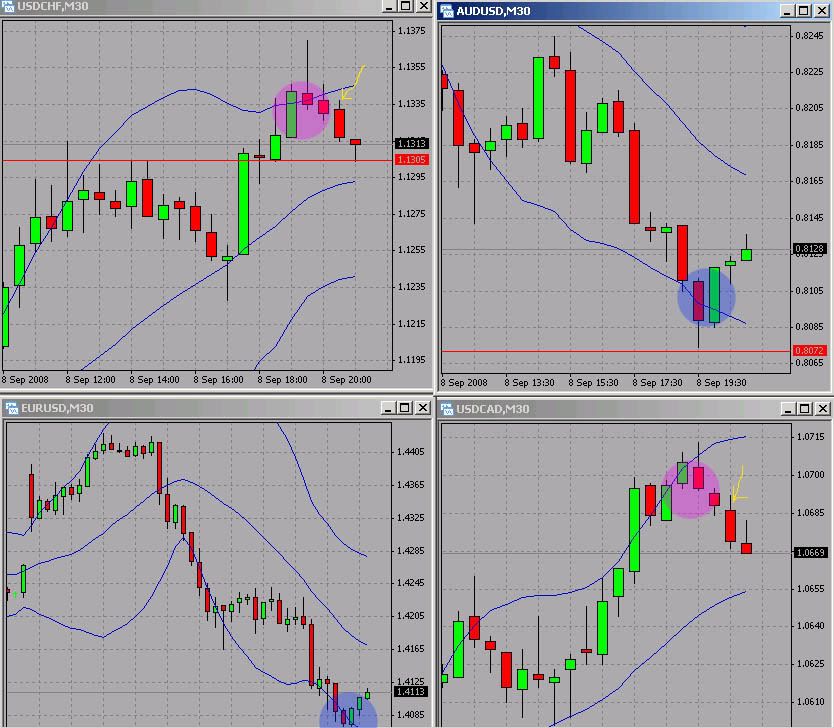
So my trades are in pink (the yellow arrows are roughly where I entered) As per the tutorials I have been concentrating on short trades and getting the entry timed right. Both trades resulted well, with the USDCAD making 10 pips and the USDCHF making 17.
However, I have also been taking a look at bullish trend reversal candles, and the two areas marked in blue are those I thought would have made good long trades, but hadnt researched engulfing candles enough to know when to enter, and didnt want to have 4 trades swinging on the USD. Both those marked in blue also went on to 25pip runs…
So what I wanted to ask was, were all those points marked entries that you guys would take or was I being reckless and lucky?
Drav
Nice charts and nice patterns.
It looks like they were all good for some pips
I have not been here for a while.
It is late now and I must sleep.
I will answer several of these posts above tomorrow.
They are very interesting.
Tymen,
I have a question about finding the basic candlestick patterns on the BB. During a long trend (I know we’re not supposed to be concerned with trends) like the USD going up lately, the price never crosses the band on the opposite side as the trend. To only enter on patterns that cross the bands means always entering against the trend. On 4 hour charts, the last time the EUR/USD crossed the upper BB was Aug. 15. So any entry would be against that long trend.
Is there a time that the rules can be broken, and an entry made when the pattern occurs close to the middle BB, if the entry takes you in the direction of a strong trend?
Thanks.
Hmmmmm.
I have seen some beautiful and very successful patterns on the lower time frames for EUR/USD.
However, you are doing the 4hour timeframe.
I am not exactly sure what you mean? 
This I know for sure - never break the rules or you are in for a loss.
Do you mean?.. no patterns on the upper BB that go down to the lower BB?
If so pick a different pattern…pick the 3 green soldiers for long trades.
You can trade this one from anywhere - not just the BB extremes.
Tymen, thanks for your quick response.
I mean, the price keeps bouncing off the middle band. In the chart, the engulfing pattern on the middle band gets you in much sooner than waiting for 3 red crows, which many times is the end of the down price movement.

[B]Thanks for the chart Condor[/B]. 
Its a great help in understanding your question.
You can try these engulfers if you want to, but I have shown at the very beginning of this thread that patterns in the middle of the bands have a high probability of going against you.
I even submitted pictures to that effect.
I have seen many an evening star in the middle of the bands looking very attractive, but only to crash.
By trading from the middle, you are removing one of the factors in your favour - price extremes which tend to drive price action back again.
That is why, throughout this thread, I have called for trading quality patterns only.
Sure you have to wait, but what’s the use trading something that has a high probability of losing?
Remember - not entering is a [U]position[/U].
That little piece of knowledge can be a key to success.
hey guys. From what I’ve noticed from the few days looking at patterns and bollingers is that the price always drops nicely from the upper bollinger band eventually, the trick seems to be timing it so the market has little upward force left and you get a nice steady cruise down. I’ve seen a lot of whipsaw price movements near the upper band these past few days, not enough to hit where we should be putting stop losses, but enough to scare me away from all but the most surefire looking trades. Which brings me to my question.
I’ve noticed that the pattern indicating a trade often has a large shadow coming out the top. In something like a big evening star or an engulfing candle, this can mean our stop is anywhere from 15-30 pips from our entry point. When we are chasing 10 pips to exit, this seems a bad R/R ratio. Any help with that?
Also, I see Condors point that in a trending market we are mostly trading price retracements against the trend no?
Cheers guys
Thats a nice looking pattern there. I missed the 30 min and 1 hour entry, but i might get in on the 4 hour entry if it works out. Looks like there is a some good pips in it.
Good luck and may the pips be with ya,
Damo
Hello all…
I’m interested to see if anyone is consistently making a profit from this style of trading Tymen has laid out for us?
I have been using GFT demo account, which has now expired. In the end though, after a month of demo trades, I ended up breaking even. I only used the refined system for the last three trades however, and there were moments when I deliberatly broke rules to try some ideas out, which didn’t always work.
So, is anyone doing well out of this? If so, what daily targets are you meeting? Is anyone doing badly and actually losing pips?
Before I invest hard earned cash into trying this out for real, it would be great to see how it will fair…
(note - of course, everyone will be slightly different as the entry/exit points are somewhat subjective, and also everyone has a different resolve to follow rules to the letter, so the more people who answer the better the global overview will be).
Thanks all…
Cord
My personal opinion is that you should try demoing it more using strict rules for at least a month, preferably at least 3 months. Act as if it was your own money and trade that way, and like i said just before [B]stick to your rules no matter what.[/B]
Then you will see for yourself whether you are making a profit or not.
If you want more time for demoing talk to Jay Pace at Kinetic Securities, Tymen recommended them to me and they have been great to me so far.
Hope this makes sense as i have had a few beers after work
Cheers,
Damo