Unilever is a multinational consumer goods corporation. Unilever products include food, condiments, ice cream, coffee, cleaning agents, pet food, beauty products, personal care and more. Founded 1919 by the merger of the Dutch margarine producer Margarine Unie and the British soapmaker Lever Brothers, it is headquartered in London, UK. Unilever is a part of FTSE 100, AEX and Eurostoxx 50 indices. Investors can trade it under the tickers $ULVR at LSE, $UNA at Euronext Amsterdam and under $UL at NYSE. Corporation Unilever owns over 400 brands. Among them, the trademarks like Dove, Omo/Persil, Knorr, Lipton, Magnum, Rexona/Degree and others. The company products are present in 190 countries.
The stock price of Unilever is in a permanent rally from the all-time lows. In the last years, one can see a sideways price action in a form of a triangle. That means, that Unilever should thrust higher towards the new all-time highs.
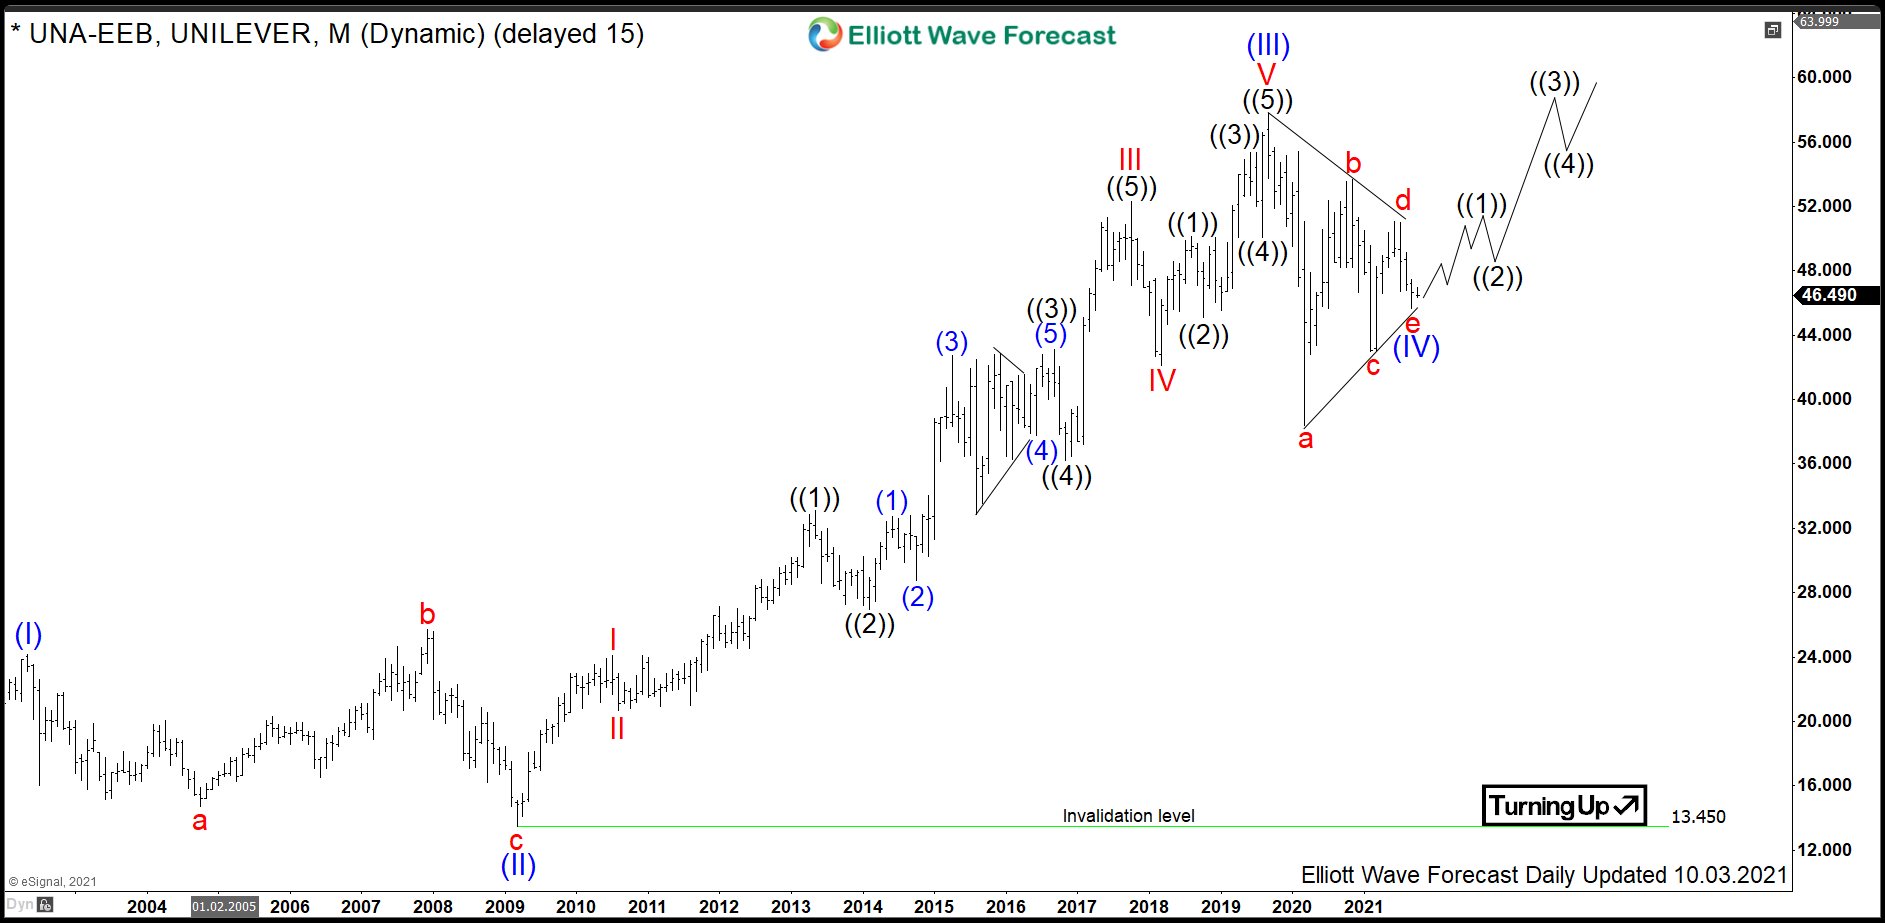
Unilever Monthly Elliott Wave Analysis 10.04.2021
The monthly chart below shows the Unilever shares $UNA traded at Euronext Amsterdam. From the all-time lows, the stock price is within the larger impulse as wave ((I)). Hereby, Unilever has finished the waves (I)-(III) by printing the all-time high on September 2019 at 57.77. Within the impulsive advance in wave (III), the internals I and III are impulsive waves, too. From the September 2019 highs, a correction lower in wave (IV) shows a contracting triangle pattern being a 3-3-3-3-3 structure. It may have ended in September 2009 at 45.64.
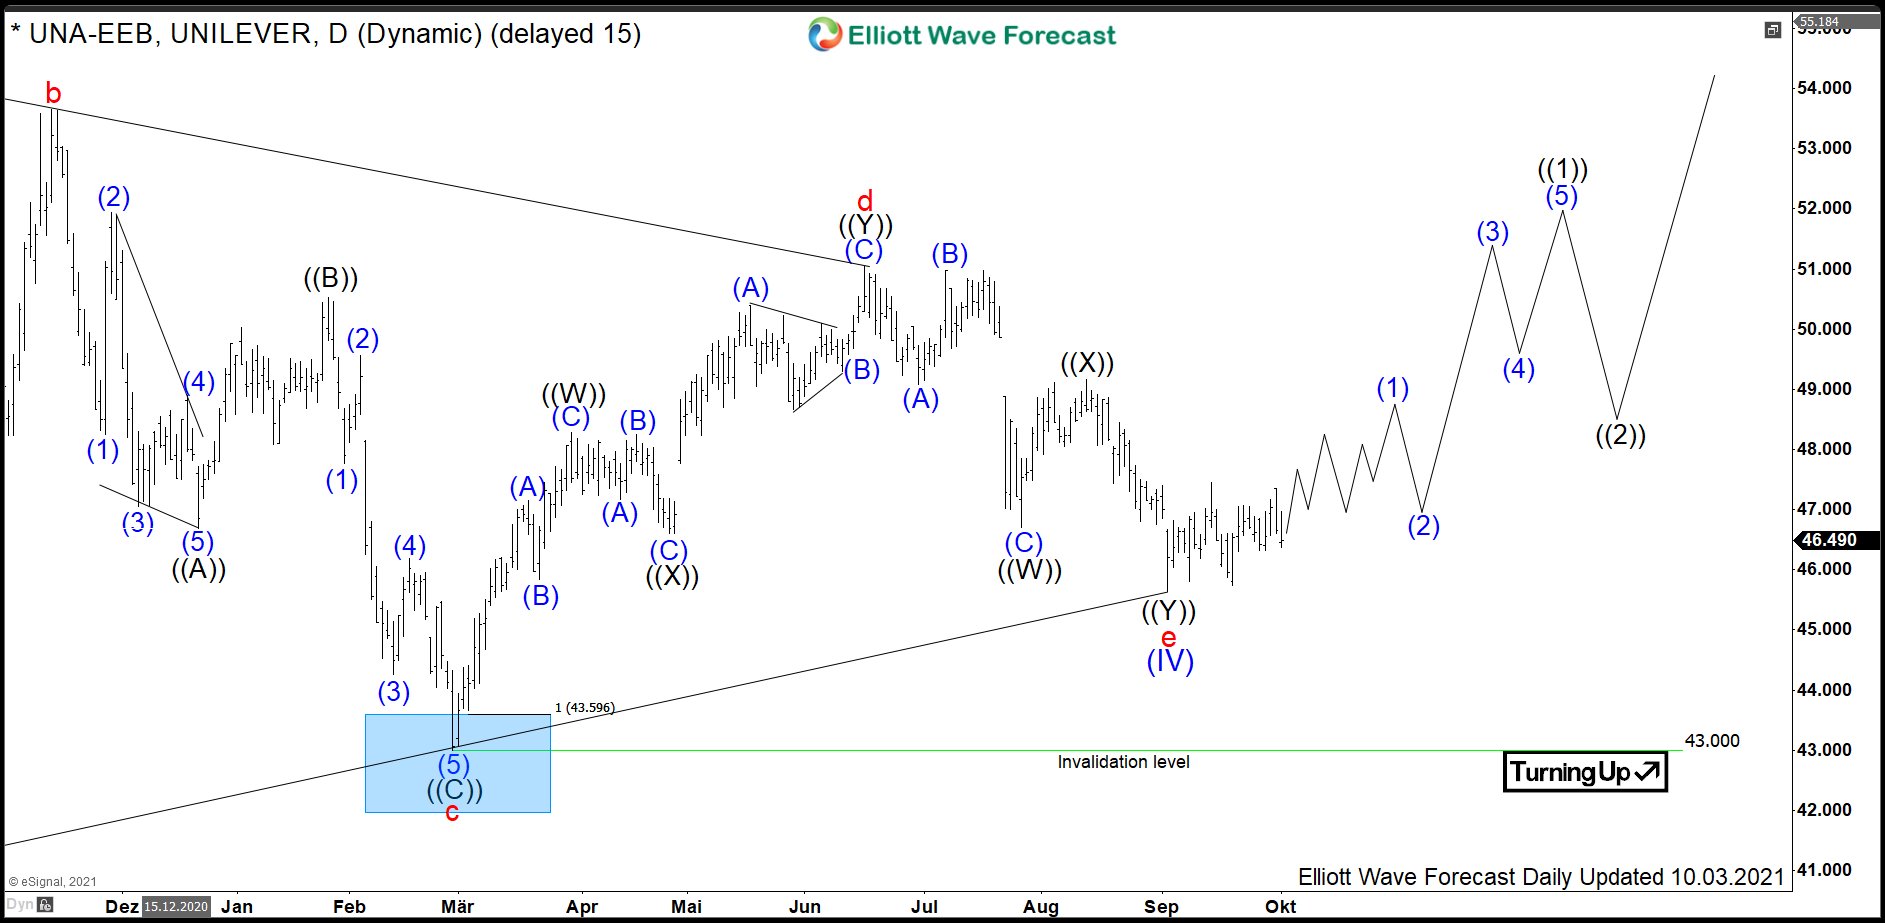
Unilever Daily Elliott Wave Analysis 10.04.2021
The Daily chart below shows the $UNA shares price action in more detail. In particular, it demonstrates the contracting legs c-d-e of the triangle. Each one is either a zigzag pattern or a double three structure. From the September 2021 low, a new cycle in wave (V) might be in the first stages and should break to the new highs…
As an outlook, while above 45.64, the new cycle in blue wave (V) should bring the prices towards 62.30-69.67 area and even higher. In a larger time scale, after wave (V) of ((I)) will end, expect a larger pullback to happen. This again should provide an opportunity later on.
Source: $UNA : Unilever Should Thrust to the New All-Time High