Understanding Price Action by Chris Capre

EURUSD
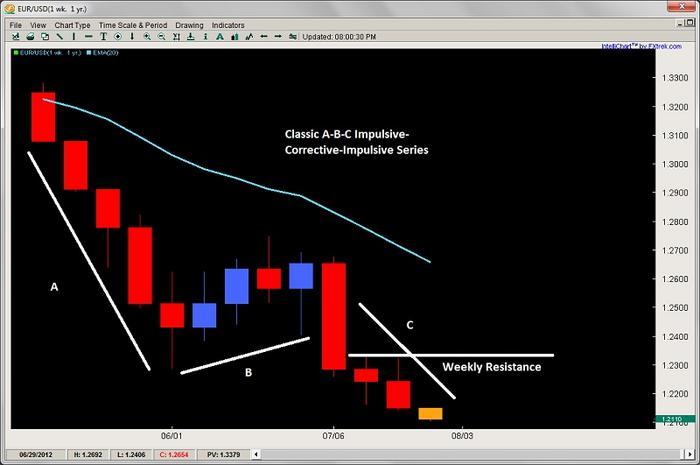
After forming a corrective pullback last week comprised of an outside bar, a double pin bar and an inside bar, the Euro resumed its natural selling posture and rightfully so considering what is happening in the EZ. The financial cancer in Spain has been metastasizing and is entering what I feel is its terminal phase with every region starting to request bailout funding. The truth is there will not be enough for all of them so something has to break.

This resulted technically in the EURUSD selling off more on friday than it had gained in the last 7 days reminding us the market will continue to be more appropos to sell Euros than buy them, and it did so by breaking the prior yearly lows, almost forming a maribozu.

Although the pair is at a major channel bottom, i’ll take price action pullbacks or rallies as opportunities to sell as I’m expecting more selling and more economic turmoil to give investors reasons to sell Euros. Immediate upside resistance is now parked above at 1.2322 which was a double weekly rejection for the prior two. Intraday players can look to short between 1.2169 and 1.2157 looking for an eventual break of 1.2100 targeting the big figure at 1.2000.


EURAUD
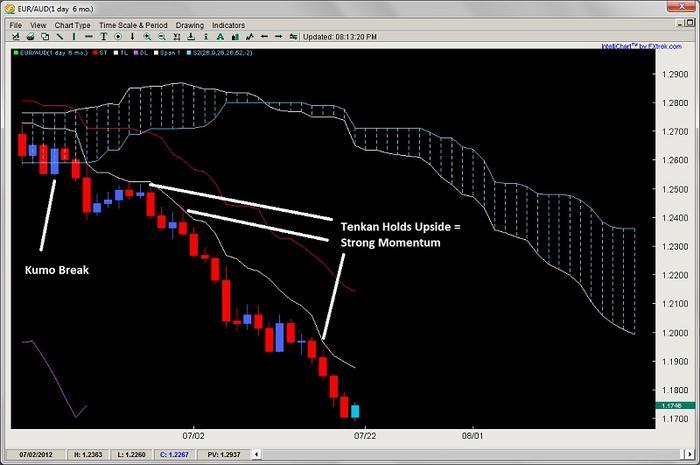
Playing on the sell the euro theme which I think will continue for the majority of this week and for some time ahead, I like selling EUR vs. AUD. From an ichimoku perspective, the pair has remained below the tenkan now since the 1st week in June which is quite an impressive run.

This is communicating incredibly strong momentum to stay below it for such a long period of time, and considering the current separation from it, we’d rather wait for a pullback to sell a rally and get back into the trend then playing a break lower. And I’m confident I’ll get it - perhaps this week with tight stops above. I’ll even consider a pullback to the Kijun to sell along with waiting for a future downward TKx signal but short is where I would like to be on the EUR vs. the AUD as it has now been selling off for 9 weeks straight. Thus, I’m expecting a natural pullback, but will take them to sell again.


USDCAD
Last week in our price action and ichimoku weekly commentary, we talked about how bulls should look for longs off the channel bottom and key support area around 1.0050/70 area. This is exactly where price stopped last week bouncing over 100pips to end the week. Many of our price action course members made profits on this with little risk so hopefully you did as well. Traders can wait for the channel play towards the upside to sell, or another pullback into the aforementioned support zone to buy the pair targeting the daily 20ema and other side of the channel.


NZDUSD
Looking at the Kiwi lately, I am noticing how it has been failing to hold above the flat top kumo even though it has rejected off of it twice - yet failed to grab hold of the upside play. This combined with the chikou failing to clear the Kumo suggests minimally likely range play short term but a possible breakdown coming soon back into the Kumo. When the chikou span struggles like this to break the Kumo in strong fashion, it usually means breakdown so I am waiting for either a sell around .8051 or a break through key support levels at .7839 and .7809 for the downside targets of .7650 and potentially .7450.


EURUSD
After starting the week under pressure from the Spanish regions requesting aid, the Euro found short term support - perhaps from the short sales ban in Italy and Spain. Although this tool is meant to curb short speculation on those economies, I’d like to point out two facts about short sale bans;
1) when have they ever worked?
2) speculators will just move their short speculation to other economies which then bear the risk (i.e. Germany and France) which then puts pressure on them, and considering Germany (e.g. German Taxpayers) is/are the bank for Europe, this will be a failed idea

Nevertheless, the EURUSD formed an intraday pin bar on the 4hr time frame at 1.2066, currently sitting at 1.2129. Does this trader think it will hold? Unlikely, this is why I prefer selling rallies either at the short term resistance at 1.2169 area (and 20ema), or should this break, wait for a pullback to 1.2312 targeting 1.2175 and 1.2075.


Global Market Commentary:
Surges in Spanish and Italian yields, along with a recent Moody’s downgrade of Germany & Holland have been all the news and pressure on global investors as they look for the exits on any risk assets. Global markets sold off from Asia to Europe to the US anywhere from 1-3% per index. Spain and Italy have re-initiated a short sale ban (good luck with that) which has failed at every attempt, but this is simply a communication of how desperate and worried they are that things will get worse.

Spain will likely need a full fledged bailout as all its regions are going bankrupt and will need assistance, meaning the money Spain got from the ESM will not be enough. Once we see how bad it really is in Spain, expect more fear and risk assets to sell off further. And don’t forget about Greece as it meets with its Troika creditors to see if they can meet their budget cuts (unlikely).

Expect the themes which started the week off with a bang to dominate till friday’s close.

Upcoming Economic Announcements:

CNY HSBC Flash Manufacturing PMI 02.30GMT 22.30EST
EUR German Purchasing Manager Index Manufacturing 07.30GMT 03.30EST
EUR Euro-Zone Purchasing Manager Index Composite 08.00GMT 04.00EST
CAD Retail Sales (MoM) 12.30GMT 08.30EST
USD Richmond Fed Manufacturing Index 14.00GMT 10.00EST

NZDUSD
After forming a virtual maribozu on Monday, the Kiwi formed an inverted pin bar which pulled handsomely back to the daily 20ema, rejected and closed just off the lows. The interesting thing about this is how it also broke the stalemate and the 1-mos range lows in the process.

I think once the pair clears the 7800 area, that further losses are in store - likely down to 7650 which if this yields, then the yearly lows around 7450 are on deck. Intraday pullbacks towards 7860 and 7918 are good locations to sell rallies intraday.


Global Market Commentary:
Greece, Spain and Pain…what more else do you need to know? The Moody’s downgrades have more of a negative effect, not so much on a belief in Moody’s, but moreso in how investors take this as a negative on the entire EZone, and how the strong countries feel like the weight of the insolvent countries/PIIGS, are hurting their stable economy.

Meanwhile, German and French PMI figures disappointed while the Richmond Fed printed its worst number since April 09 and Treasury Yields tumbled to all time lows (wait, there is more), 30Y GGBs have tumbled to record lows while the Troika said Greece will miss their deficit reduction targets (surprise there). All this while Spanish yields hit over 7.6%. The problem is both the insolvency of these countries while having markets that have been artificially propped up. Eventually, this will come home to roost.

The Dow dropped 104 pts while the S&P 12pts.

Upcoming Economic Announcements:

AUD Consumer Prices Index (YoY) 01.30GMT 21.30EST
EUR German IFO - Business Climate 08.00GMT 04.00EST
GBP Gross Domestic Product (YoY) 08.30GMT 04.30EST
USD New Home Sales 14.00GMT 10.00EST
NZD Reserve Bank of New Zealand Rate Decision 21.00GMT 17.00EST

Many thanks for taking the time to post your (very comprehensive) anylsis Chris, have watched some of your videos, must re-visit.

Hello Peterma,

Am glad you are liking it. This is just the tip of the icerberg in terms of depth of analysis and knowledge, but hopefully it gives you some idea.

Anyways, stay tuned as I’ll have something again tomorrow.

Kind Regards,
Chris

EURUSD
After forming a new yearly low last week, the pair produced its strongest 3 day climb (from top to bottom) for the entire 2012 year which is impressive considering the economic situation is far worse than it was in 2011. I suspect this was more of a short squeeze than anything, and am really just waiting for the shoe to drop (any) which means either Spain asking for another bailout and admitting they are broke, Greece leaving the EZ, or Germany not wanting to bail out any more countries.

Regardless, I’m taking the sell rallies approach, especially considering the range of the last two days which is a choppy range with the 1.2389 highs and 1.2224 lows. Intraday players can look for price action reversal plays at these levels should volatility and volume be down for tomorrow. Meanwhile, my sell on rally point is first parked at 1.2415 which was range support for the last 3 weeks of June. My other medium term rally point to sell is the weekly 20ema and Jan. 12’ lows at 1.2630.


EURAUD
In last weeks price action & ichimoku chart commentary, I talked about how the EURAUD was a pair I was looking to sell on pullbacks to the Tenkan line as it held below this since late June, and every pullback to the tenkan line resulted in a rejection and further losses. This is exactly what happened last week as the pair (after forming an outside bar) faltered into the tenkan line, and continued selling off over 150+pips so with very little stop needed so hopefully you profited from this.

Intraday ichimoku traders can wait for a pullback again to the daily tenkan, or perhaps a deeper pullback to the 1.1750 level which is the 4hr tenkan and range support that is now resistance.


AUDUSD
Speaking of the Aussie, the AUDUSD has climbed for the last 5 days which is impressive since its only done this 5x in the last 1.5yrs. What is interesting to note is it has not had a 6 day climb for all of 2012 and only 2 of 2011. This, combined with the fact (from an ichimoku number theory perspective) we have already climbed for 1 period and 1 section since the yearly bottom on June 1st I am suspecting a bear day tomorrow is the higher probability outcome.

Although the Chikou has finally cleared the Kumo, and the tenkan/kijun are still climbing strong, I am looking for the pair to fade in the very near future, either at 1.0551 or 1.0642 and will look for intraday ichimoku sell signals at those levels. Bulls can meanwhile wait for corrective pullbacks towards the daily kijun which held the last bounce and produced the 5 day climb you see today.


Dow
Climbing for three days straight, the DOW is approaching a major resistance which is the yearly highs at 13300 and the triple top as well which starting the sell off towards the yearly lows so it’s pretty hard to ignore this potential signal coming up. I will look for price action triggers at this level along with weakness on the intraday charts with tight stops above targeting 13151 and 13042 offering some really strong reward to risk ratios. A break and close above the yearly highs suggests likely continuation so look for a breakout pullback setup here.


*NOTE - sorry to mix in some ichimoku trades here. I’m mostly on vacation for July, but in early August, I’ll be starting a specific thread for ichimoku trading so coming soon.

Hello, thank you very much for sharing your great knowledge on Price Action with us. Could you tell me how you decide when you use Price action only (with 20ema) or Ichimoku Cloud? You don’t seem to give us your analysis both Price Action and Ichimoku Cloud on one pair at the same time…

Thanks,
Chublet

Hello Chublet,

Yes, I try not to mix the two as I want traders to see how I do pure price action analysis, and pure ichimoku analysis so you can parse out what tools I am using and how.

This also allows people who are just fans of price action to get some analysis they like while those who just like ichimoku to get ichimoku analysis as well.

Hopefully this explains it but glad you are enjoying this thread.

Kind Regards,
Chris

*I’ve been gone for 5 weeks on vacation but am now back writing from command central so expect articles daily from Sun-Thur from here on out along with bonus articles on Friday.

AUDUSD
Since the 20th of June, the Aussie has been in an upward sloping channel which has been rather orderly making a touch on the top and then venturing to the bottom…until recently. Lately, it has been hanging around the upper band of this channel and putting pressure on the topside (along with the sellers in the market). SEE CHART BELOW.


Generally, when you see this in a range or channel, it means the sellers are being squeezed out of the market as they are unable to make any progress to the downside while the bulls apply continuous pressure on them squeezing them out of the market. This ability for price to remain towards the upper boundary of the channel will no doubt bring other players in who are also noticing this price action. Thus, I am favoring more of a breakout to the upside.

However, I do see a sticky level below which is a failure point for me, meaning should the bulls fail to hold this level, then the bears should be able to make some headway to the downside. This failure point at 1.0533 is a nice role reversal level which was resistance back in the end of July and support on Aug. 7th. Should this level fail to hold the price action up, I would suspect this could be a good place for bears to get in as prices should decline to about 1.0445 which was also a role reversal level and a key support area behind this last leg, so plays for both bulls and bears here.


Thanks Chris…very useful post.

Could you expand a little on how you can tell the difference between price staying near the top of a channel/range but likely to fail as against when signs point to a breakout please, at least as far as it is possible to do so.

Glad you enjoyed your holiday…5 weeks is very French…as you may know Paris closes in summer, except for tourists, and everyone heads down to St Tropez!

Hola Michael Ji,

Ohhh, you’re putting me in a tough position as I’m working on a more thorough video for this in the price action course. Let me think about it and how I can comment on this without giving too much from the video away.

To be continued.

Kind Regards,
Chris

1 Like

"No worries Chris l’m actually on the course anyway! " he said selfishly!!:slight_smile:

l know that sounds like an “l’m alright Jack” attitude from me but l know you give so much info away for free that you have to save some of the finer details for students on your course or we’d be complaining! Anyway, l’ll keep an eye out for it so thanks!

Hello Michael,

Ok, a few pointers here:
Successful Breakout
-should see the 20ema continue to hold prices up or down as it continues to squeeze the sellers/buyers out along with a few doji’s at the key level. If its a horizontal level, the price action should continue to squeeze upward/downward without any major break of the 20ema or recent support areas. this represents the losing party being unable to make any headway and the last few players resisting the upcoming move.

Failure
-should see the 20ema hold as s/r for a bit but then fail to hold prices meaning the defenses that were squeezing price out did not have enough liquidity and backing to continue the pressure all the way through the break

-also a major s/r level should be broken in the process along with a strong reversal bar located at the upper/lower boundaries of the channel/levels, ideally taking out several candles prior

This would be just a few pointers but will give more and a deeper explanation in the course video coming this weekend.

Hope this helps.

Kind Regards,
Chris

Just great insight and practical advice as always,many thanks Chris and really looking forward to the video. l can see you are raring to go after your vacation!

Thanks again and have a great weekend.

l’m just wondering what surprises the Olympic closing ceremony will hold after that wonderful opening one, or at least imho it was!

[B]Hello Chris[/B] :slight_smile:

Welcome to Babypips! The natives here are quick to defend this domain from those who might look to fleece an innocent. Having a commercial website puts you in the crosshairs in most folks eyes here, it’s a tough crowd but that’s understandable. Having been baptized in the fire myself here at Babypips… I know how it can be. However, if you are serving in good faith, it will be recieved.

I only have one question… what is the story behind the name 2ndSkiesForex?

[B]Good Luck With Your Thread[/B] :57:

Hello InnerCircle Trader,

At this point I think the locals feel comfortable with me and I already have some genuine followers from this thread and my site so I think this catches on.

If people follow and learn from it - great. If not, no worries and I hope they find what they are looking for.

In terms of the name, 2ndSkies came about when I started this company which I felt was like a new beginning into the 2nd part of what I love (trading and teaching, teaching being the 2nd part). So for me, to be able to do both after such a unique start felt like a new horizon, (or 2nd one) that I was making.

Hope this helps explain it.

Kind Regards,
Chris

Yep, am rearing to go as I was doing a lot of study during my long flights so building up a lot of material and amplification of what I already do. Video coming soon though.

Kind Regards,
Chris

EURUSD
After the massive losses in the Euro from mid-April to mid-July, the pair has been forming smaller price spreads (in the downtrend) while the bulls in the counter trend move are starting to out strike the bears. This to me is suggestive of an exhausted 3-mos down-move finding no new bears (at the moment). This has led to the bulls demonstrating some ability to take short term control as they continue to build higher lows and higher highs with greater volatility (meaning greater participation from the bulls).

We are though in a channel for the last 3 weeks which is relatively structured, offering plays for bears and bulls (slight edge to bulls for now short term).

Why do I short term favor the bulls?

Well, since the start of this channel on July 19th, out of 17 days, there have been 11 bear bars printed with 6 bull bars, yet the prices are printing higher lows and higher highs, communicating who is in control. Thus, if you are playing intraday, you are more likely to profit on the bear side, but with less profit. However if you are playing the bull side, you have a greater chance of more profit, but less opportunities probability wise, so pick your tonic.

Bulls can watch for plays on the lower end of the channel around 1.2215/20-ish while bears can look for plays around 1.2450 which is a nice role reversal level, and 1.2500 being the projected channel top and round number.


AUDUSD
After an impressive 2-mos climb of 1000+pips from the pin bar off .9600 to the 1.0600 figure, the Aussie appears to be in a re-distribution phase minimally, and possibly running out of steam. Although the Chikou is clear of the Kumo, and the Tenkan and Kijun are in strong trending order, the last several days have been unimpressive from both sides of the market. With the bulls in control, and the bears providing very little push back, why haven’t the bulls capitalized and taken out the recent swing highs at 1.0612?

Although price action has formed a pin bar off the tenkan, it still needs to clear the 1.0612 highs before attracting any new buyers. If the pin bar lows and tenkan fail to hold with a daily close below 1.0500, I suspect we could see a pullback towards the Kijun at 1.0350 before bulls come back in as there doesn’t seem like much enthusiasm at these levels. It should be noted that since price has been above the Kijun back in early June, this is the second longest flat period for the Kijun. But this time, it is happening with declining volatility so a pullback seems natural at this point.


Gold
Stuck between the $1630 and multi-year support at $1530 since May, the precious metal is making a case for a potential upside break in the near future. From a basic price action perspective, the upside level continues to be attacked (4x since May) while the downside level has only been attacked (3x) and it was all done in the month of May. Since then, the metal continues to build higher lows and sharper price action angles on the downside, which is definitely putting pressure on the bears holding the defenses at $1630. The last pullback rejection from $1630 only sufficed one day below the 20ema, and has since resurfaced above it, further communicating the continual pressure from the bulls.

Since we have not had a daily close above this level since May 7th, I suspect any daily close above it will bring in a fresh round of buyers so watch for a breakout pullback setup here as I don’t expect any breakout to take off for the moon since the volatility has been so low lately. If a breakout is to occur and this price action squeeze or pressure continues as is, I’d expect a breakout either this week or the next as there isn’t much more room for this pattern to play with, suggesting a quiet accumulation is building for the precious metal, perhaps for a big upcoming Aug/Sept. move which is the traditional time Gold has made its big surges historically. Bears can simply take plays off this key resistance level with tight stops above targeting the daily 20ema.


Dow
Climbing 4 weeks in a row, the Dow has gained 7 of the last 10 weeks since the yearly lows printed in early June. The index has been well supported as of late with all the major rejections being to the downside and two weeks ago forming a with-trend pin bar off the weekly 20ema.

However, price action is approaching a critical resistance at 13300 which is the yearly high and a daily triple top. It should be noted it is doing this on some of the weakest volume in over 5 years, suggesting the institutions are not really buying into this. I think there is definitely a price action play here around 13300 with stops above the yearly highs targeting 13051 and potentially the weekly 20ema around 12850


AUDUSD
As I talked about in yesterday’s price action & ichimoku outlook, the price action for the Aussie communicated it was likely running out of steam and the pair may be rolling over. Although the pair hasn’t made major ground or broken the key support level at 1.0496, it did form a daily inside bar.

Although this is not uncommon per se during consolidations, the fact it happened after a with trend pin bar and closed for the second day down, suggests a continual weakening in this uptrend. Keep in mind, since the June 1st pin bar and yearly bottom, there have been 52 trading days with 32 bull closes and 20 bear closes. Of those 20 bear closes, only 6 (30%) have been followed by another bear close.

From a short term perspective, there is a range in play which is the high and low of the with trend pin bar. But today’s inside bar had a stronger close towards the bottom with a longer rejection wick at the top so the pressure for the day was mostly down. If the 1.0496 level fails to hold tomorrow, I’m expecting a move to 1.0445/50 which houses the daily 20ema and the Aug. swing lows so a possible level for bulls while being a nice bear target for intraday players.


Global Market Commentary:
While summer volatility remains low and global investors sit on the sidelines, wondering when the next CB will come in and prop up the stock markets, global indices took a small pause with mild losses from Asia, to Europe and over to the US, losing anywhere from .07% - .5% so mild losses across the board.

Japan’s growth was well below expectations along with Chinese consumption data also coming in sub par, hinting at a cool down in the strongest Asian economy. Frau Merkel is back from vacation and there are still doubts the High Court will consider the ESM a legal mechanism for bailing out Spain and Greece (which would put a damper in the region). Needless to say money between the regions has dried up considerably, which doesn’t help distressed economies.

Speaking of Greece, as nothing has been really solved there, talks about preparing for a Grexit continue to get louder, which may be an already inevitable consequence at this point.

Although volatility has been low as of late, expect tomorrow to have a little more steam in its stride with a host of important economic events on the docket.

Upcoming Economic Events:

CNY Actual FDI (YoY) 00.00GMT 20.00EST
AUD NAB Business Confidence 01.30GMT 21.30EST
EUR French Gross Domestic Product (YoY) 05.30GMT 01.30EST
EUR German Gross Domestic Product n.s.a. 06.00GMT 02.0EST
GBP Core Consumer Price Index (YoY) 08.30GMT 04.30EST
EUR Euro-Zone Gross Domestic Product s.a. 09.00GMT 05.00EST
USD Advance Retail Sales 12.30GMT 08.30EST

AUDUSD
Sticking with the Aussie today, which I’ve been bearish on since Sunday - the pair sold off yesterday and formed a bottom off 1.0496 via an intraday pin bar setup. But notice how the reaction off said bottom was corrective while the selling price action was impulsive? This clued me into the fact the pullback was not heavily bought up by the institutions, and to look for a pullback setup at a good level.

Enter the 1.0533 area which I talked about on my price action commentary (last Thursday) as being a critical role reversal level. Sure enough, the pair started strong after the London open, only to struggle at this level for the next 6hrs forming two inside bars, but ending with a very strong engulfing bar to break the stalemate.

The strong engulfing bar was a clear communication who was still in control (sellers) and that the impulsive selling should continue. After a little fight at the 1.0496 support level, the pair finally broke it, but has since petered out. No surprise on the lack of follow through, as the markets have been putting most to sleep lately, even those who drink 10 cups of coffee before trading, or have ADHD.


Global Market Commentary:
A see saw of news today starting with Europe as the GDP numbers and ZEW came in much worse than expected, darkening the outlook as the EZ economy continues to shrink (quelle surprise) across the bloc with even the German economy slowing (no bueno) while the southern neighbors continue to borrow from the ECB at an alarming rate. This of course will continue to force politicians and European leaders to jawbone about how they will save Europe but offer no real solutions.

On the other side of the pond, July Retail Sales surprised to the upside, but was moreso a seasonal adjustment. Either way, nothing really moved much. But the July surprise sales numbers meant Good is Bad because this means a further delay of any CB printing money to save the bankers.

Gold was the main loser dropping about $12 on the day to close just below $1600, with all the US markets trotting in place on absolutely low volume and a low VIX print while European markets gained anywhere from .5-.9% on the day.

Upcoming Economic Announcements:

CNY Actual FDI (YoY) 00.00GMT 20.00EST
AUD Westpac Consumer Confidence Index 00.30GMT 20.30EST
GBP Bank of England Minutes 08.30GMT 04.30EST
GBP Jobless Claims Change 08.30GMT 04.30EST
USD Consumer Price Index (YoY) 12.30GMT 08.30EST
NZ Performance of Manufacturing Index 22.30GMT 18.30EST