United States Oil Fund Elliott Wave & Long Term Cycles $USO
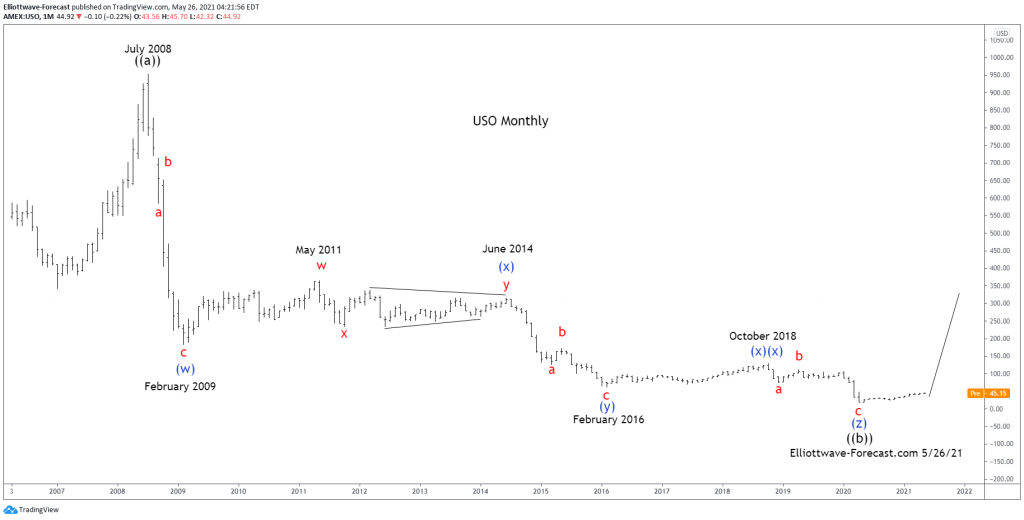
Firstly the USO instrument inception date was 4/10/2006. CL_F Crude Oil put in an all time high at 147.27 in July 2008. USO put in an all time high at 953.36 in July 2008 noted on the monthly chart. The decline from there into the February 2009 lows was in three swings. An a-b-c in red although it was a very steep pullback.
Further, the bounce from the 2009 lows is a complex double three combination with a triangle “y”. This is w-x-y in red to end the blue wave (x). In either a bullish or bearish market this particular structure always makes a high or low in the initial wave “w”. After a wave “x” correction, structures like this will be followed by a contracting or running triangle. In this case the structure ended in June 2014. The decline from those highs were very sharp again. As can be seen, this was in three swings again a-b-c in red to end the blue wave (y). This completed a three swing correction (w)-(x)-(y) in blue from the July 2008 highs.
The analysis continues below the USO Monthly chart.
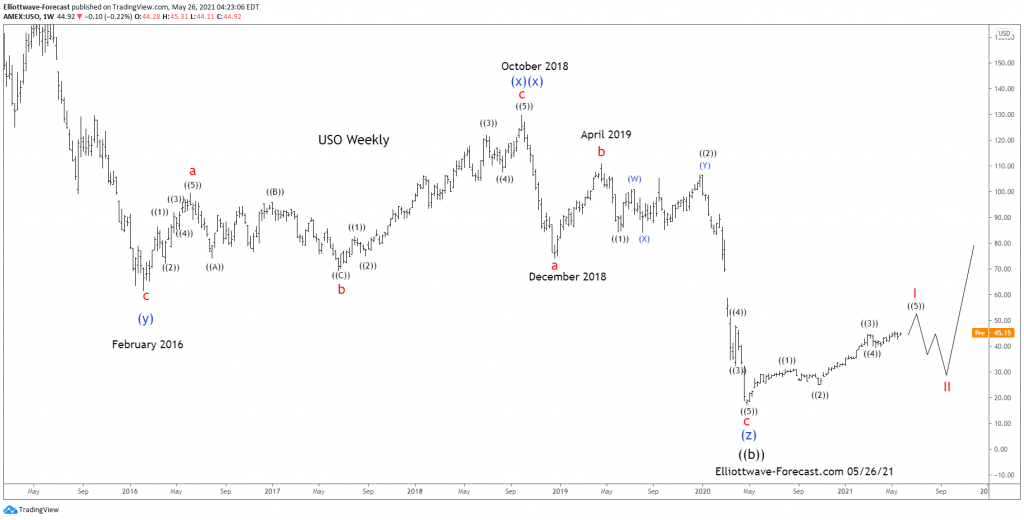
Secondly CL_F Crude Oil and the USO instrument as previously mentioned made an all time high back in July 2008. Each of the cycles appears to have declined in three big swings into the February 2016 lows. In the case of USO the price was 61.36. The bounce into the October 2018 highs was three swings again. The analysis continues below the USO Weekly chart.
In conclusion: The USO mirrors CL_F Crude Oil. The bounce from the February 2016 lows into the October 2018 highs appeared to have been a zig zag. Further this is a second (x)(x). As can be seen the decline from the October 2018 highs to the December 2108 lows was five waves and labeled “a”. There was a bounce that failed in April 2019 labeled “b”. Wave “c” made new lows in April 2020. Lastly the bounce from there appears impulsive. While pullbacks remain above the April 2020 lows expect it turning higher again.
Source: United States Oil Fund Elliott Wave & Long Term Cycles $USO

