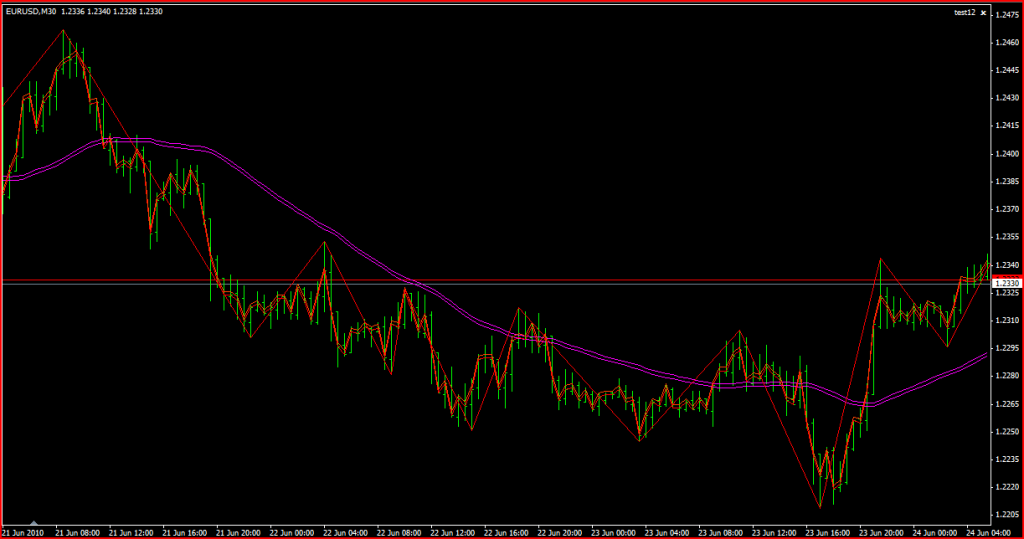
an easier way than trying to explain it might be if you are using mt4 put the zigzag indicator on, it will help show you what higher highs and lower lows are, then put a 55 periods moving average on, it will show you the trend.
As you can see the lows are getting progressivly lower untill the trend bottoms out and the new high to the far right of the image is higher than the previous one started an uptrend, the 55 periods moving average illustrates that trend change too