In our previous article, we mentioned that Uranium ETF (ticker URA) has ended correction to the cycle from 2020 low and ready to resume higher. In this article, we will update the outlook for the ETF. We see the commodity complex forming a high on early February 2023 and pulling back. We see further pullback in $URA in near term before it is ready to resume higher again.
$URA Elliott Wave Chart Monthly Chart
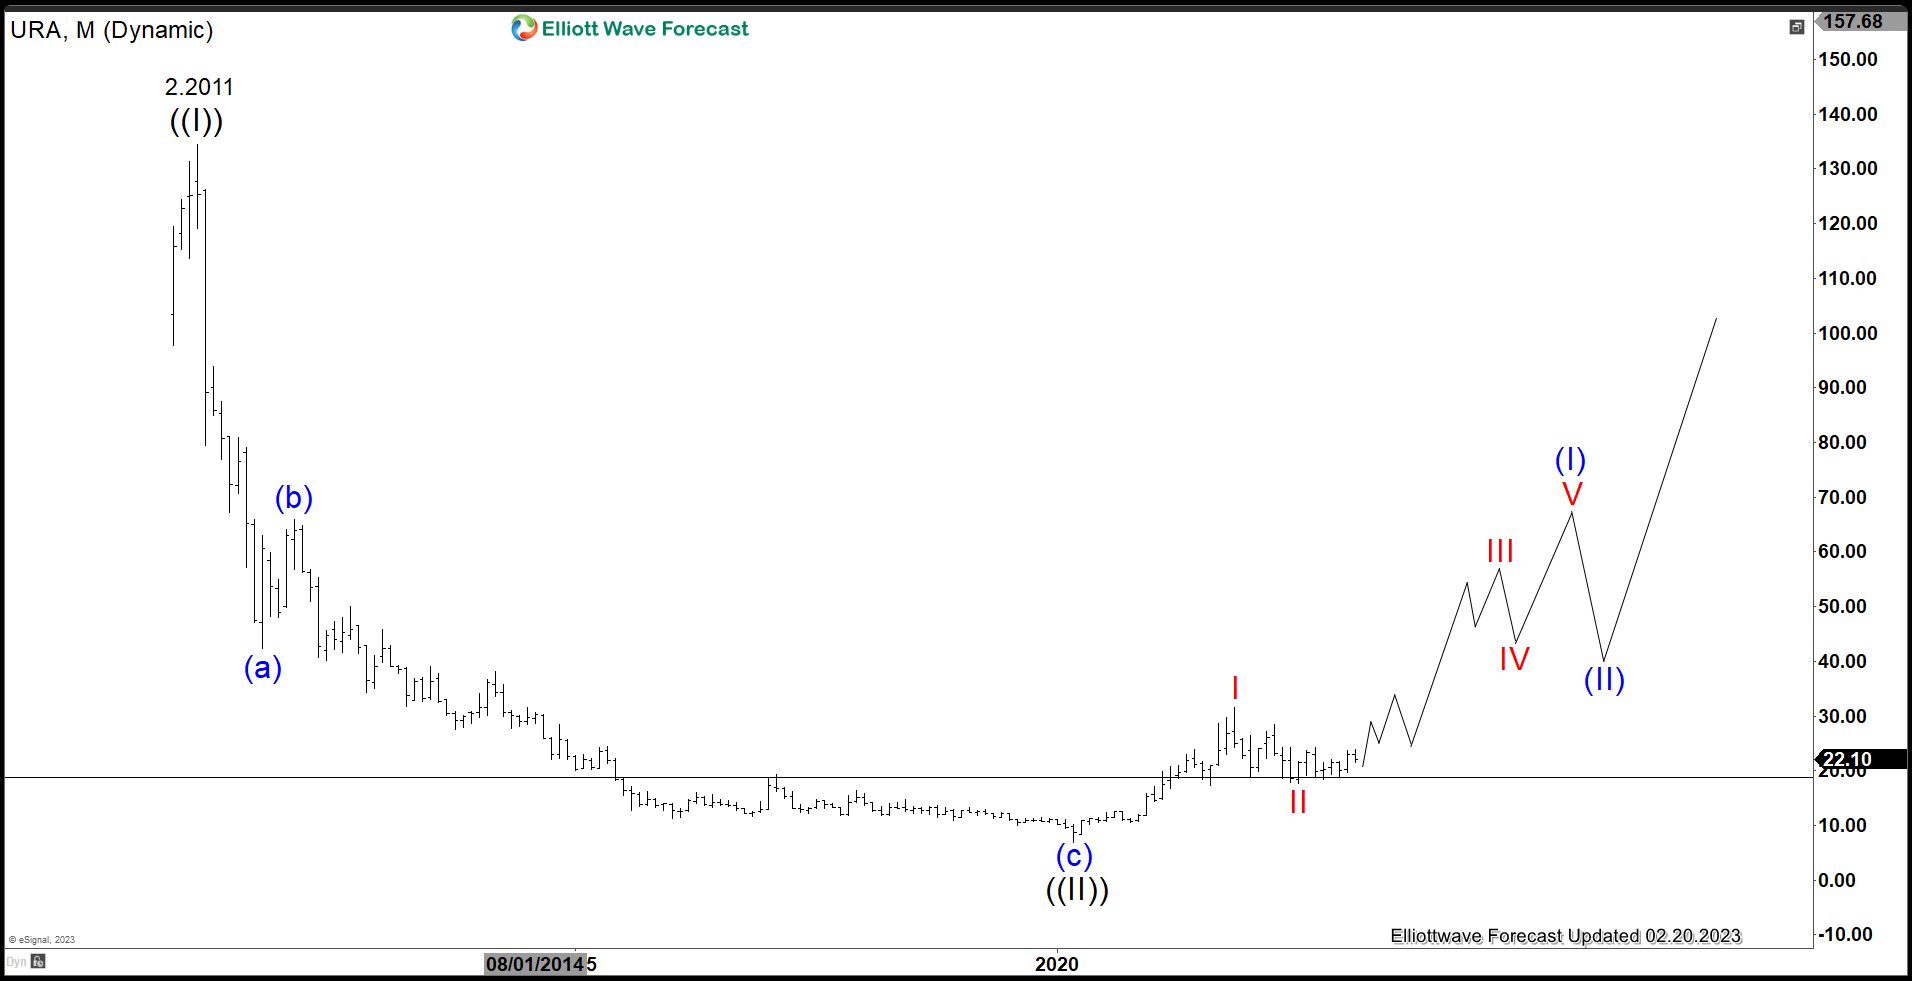
Uranium ETF (URA) Monthly Chart above shows a horizontal support/resistance at $19. The ETF so far continues to hold above that level, which is a good sign. Since it bottomed on March 1, 2020 low along with other World Indices, it has started to rally in what we call as a 5 waves. We label the bottom on March 1, 2020 low as wave ((II)) at 6.95. Up from there, the ETF starts a new bullish leg with wave I ended at 31.6 and pullback in wave II ended at 17.65. While it stays above 17.65, expect the ETF to continue higher in months to come.
$URA Daily Elliott Wave Chart
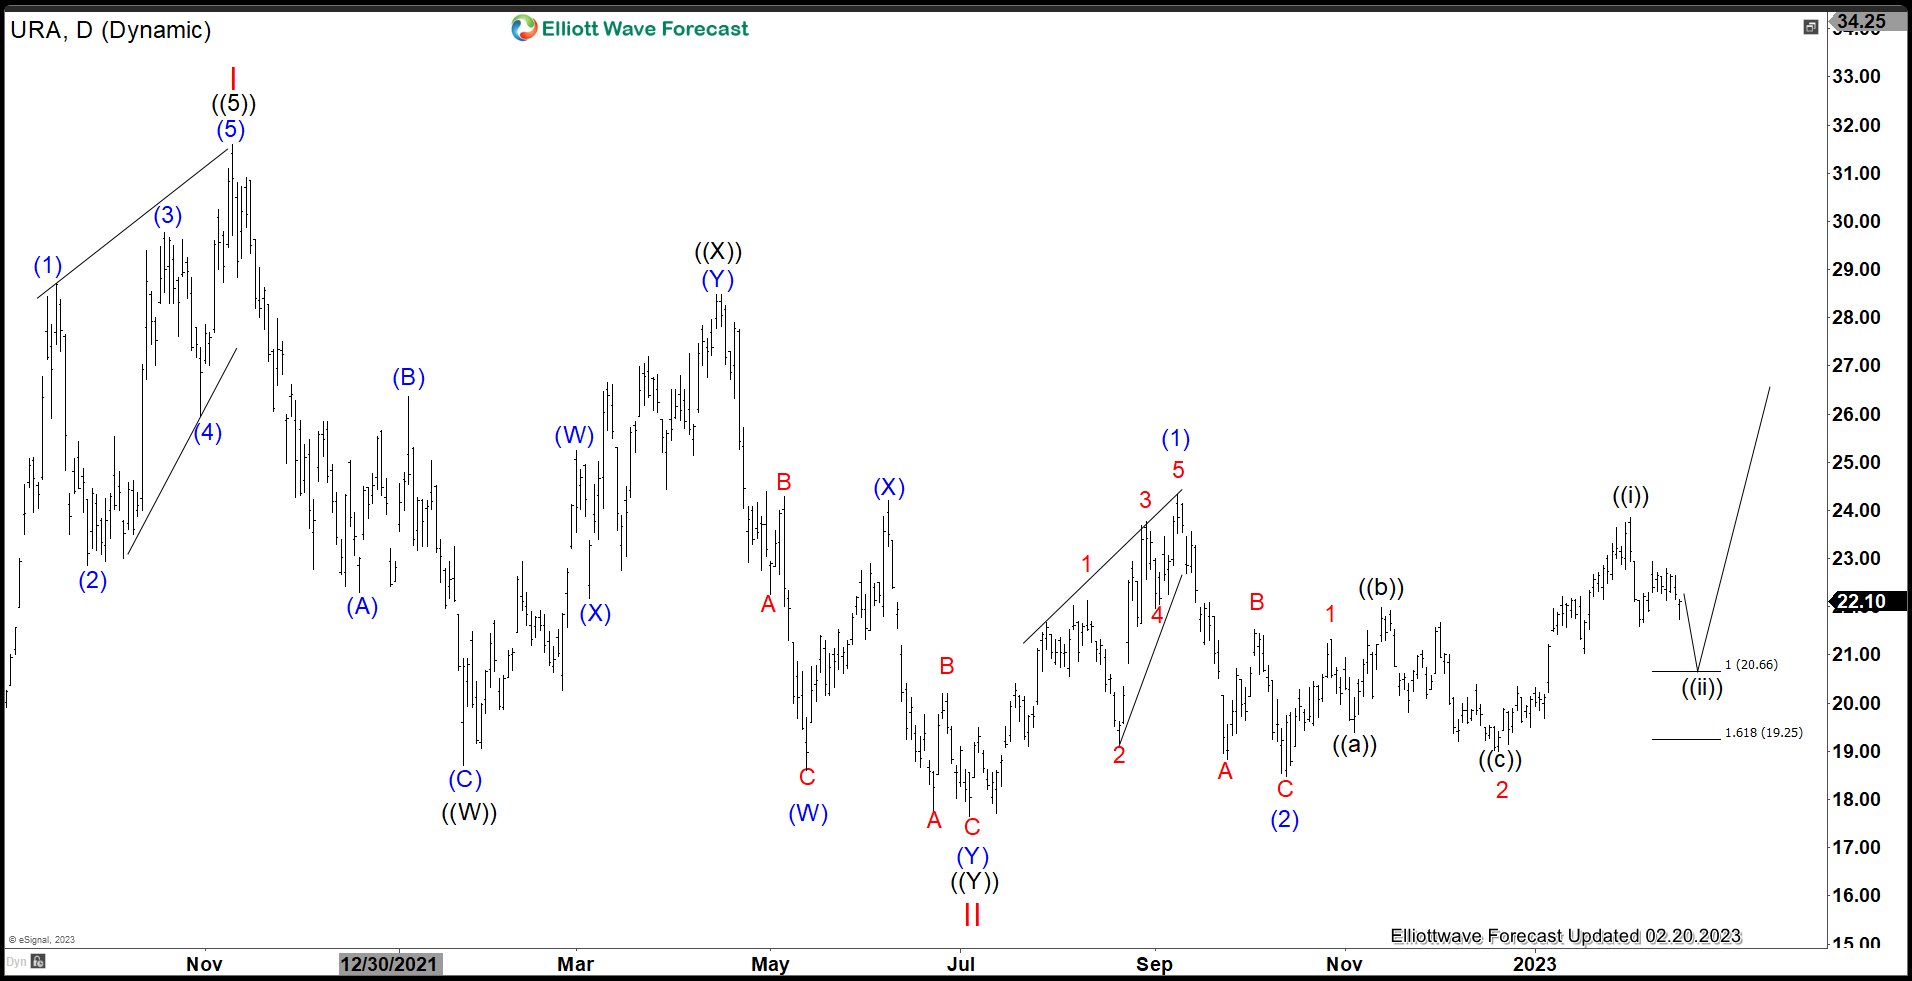
While the major low in ETF came at 6.95 on March 2020, daily Elliott Wave Chart of Uranium ETF (URA) above shows that the ETF possibly has formed a secondary low at 17.65. We label this secondary low as wave II. From there, it has rallied higher in a series of nest. Up from wave II, wave (1) ended at 24.34 and pullback in wave (2) ended at 18.47. The ETF extends higher again in wave 1 at 21.33 and wave 2 ended at 19. The last high on February 2 was a wave ((i)) at 23.86. Expect a pullback in wave ((ii)) to continue to reach the extreme area of 19.25 - 20.66 before the ETF extends higher again. As far as wave 2 low at 19 holds, dips should find support in 3, 7, or 11 swing for further upside.
Source: https://elliottwave-forecast.com/stock-market/uranium-etf-ura-pullback-progress/

