The long term fundamental background for Uranium is very promising. Shift towards green energy and less reliance on Russian’s oil should support Uranium. One way to capitalize on this opportunity is with the Uranium Miners ETF (URA). The ETF invests on the Uranium itself as well as several mining companies in this sector. The monetary tightening by the Fed has created a tsunami of selloff in the market. The selloff is especially heavy in the tech and growth sector. Commodities however remain to be one of the few sectors which remain positive due to the high inflation environment. Recent pullback in Uranium may give investors an opportunity to participate in the sector.
URA Monthly Elliott Wave Chart
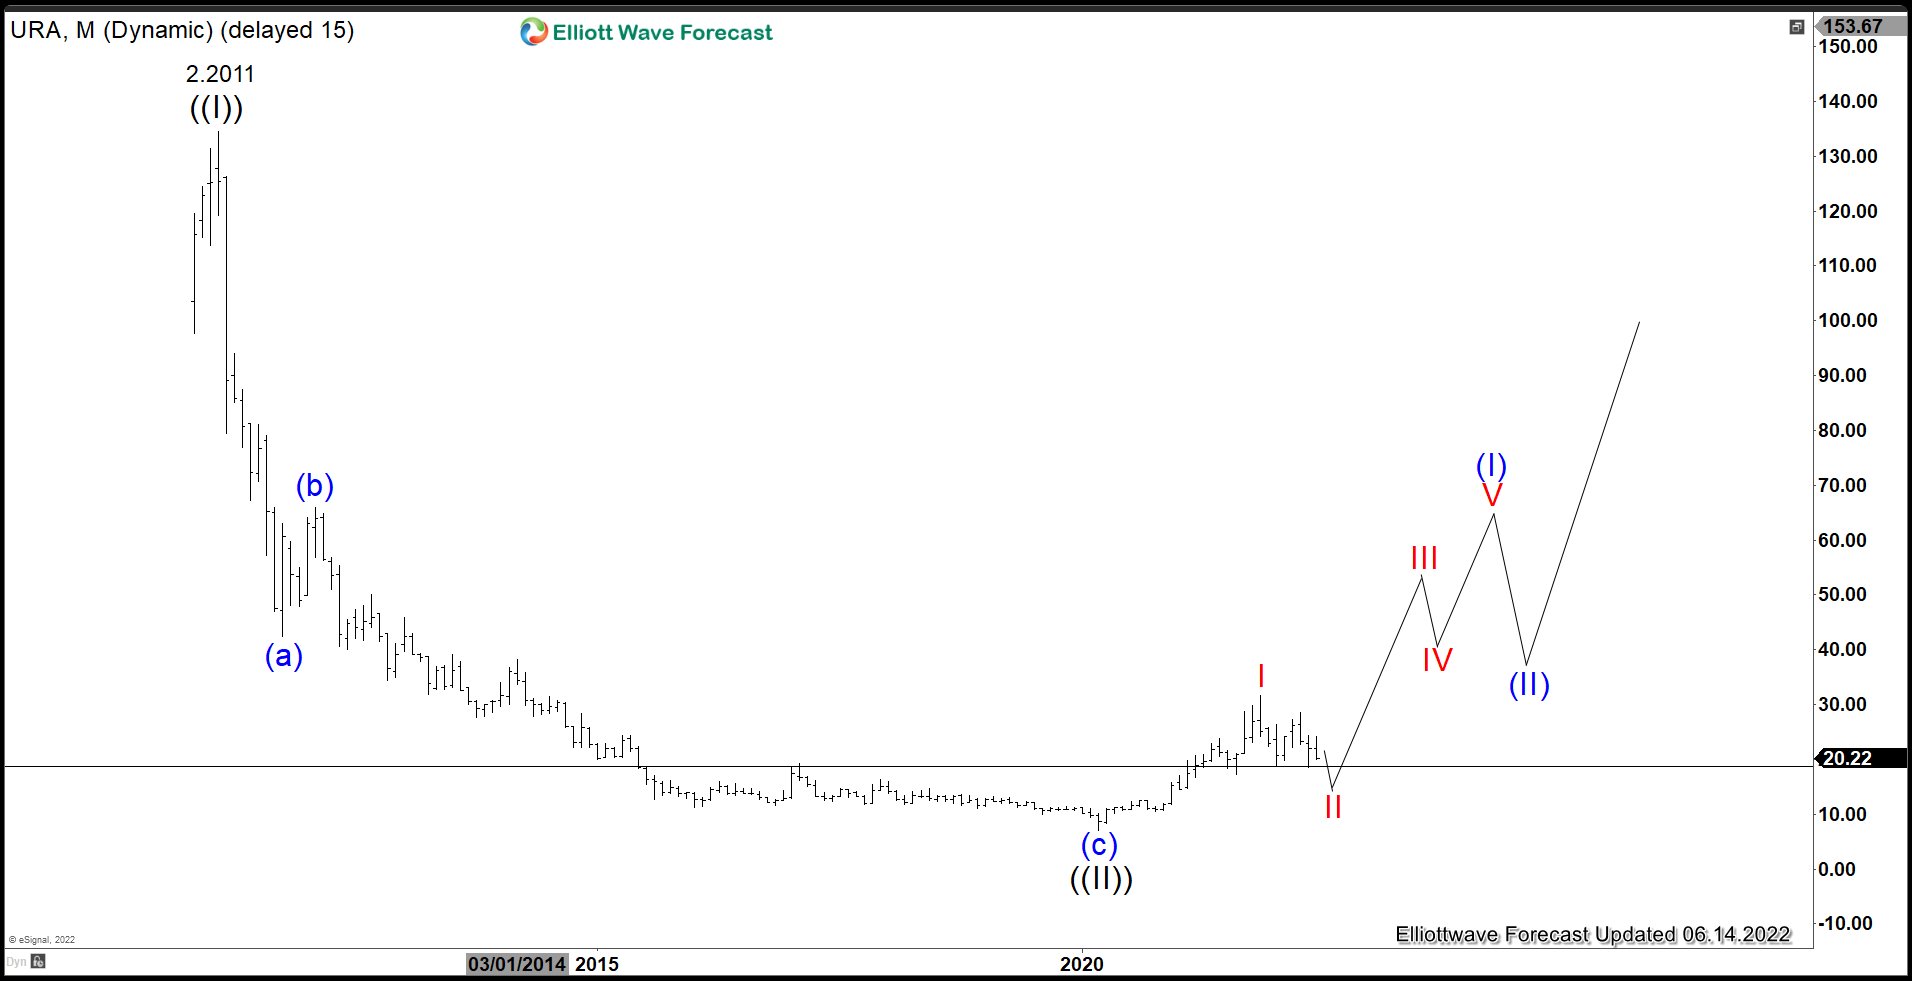
Monthly Elliott Wave chart of Uranium Miners ETF (URA) above suggests that the ETF ended wave ((I)) on February 2021 peak at 134.52. and the pullback in wave ((II)) low ended at 6.95. Wave ((III)) is now in progress with internal subdivision as an impulse. Up from wave ((II)) low, wave I ended at 31.6, and wave II pullback is in progress to correct the rally from wave ((II)) low on March 2020 before the rally resumes.
URA Daily Elliott Wave Chart
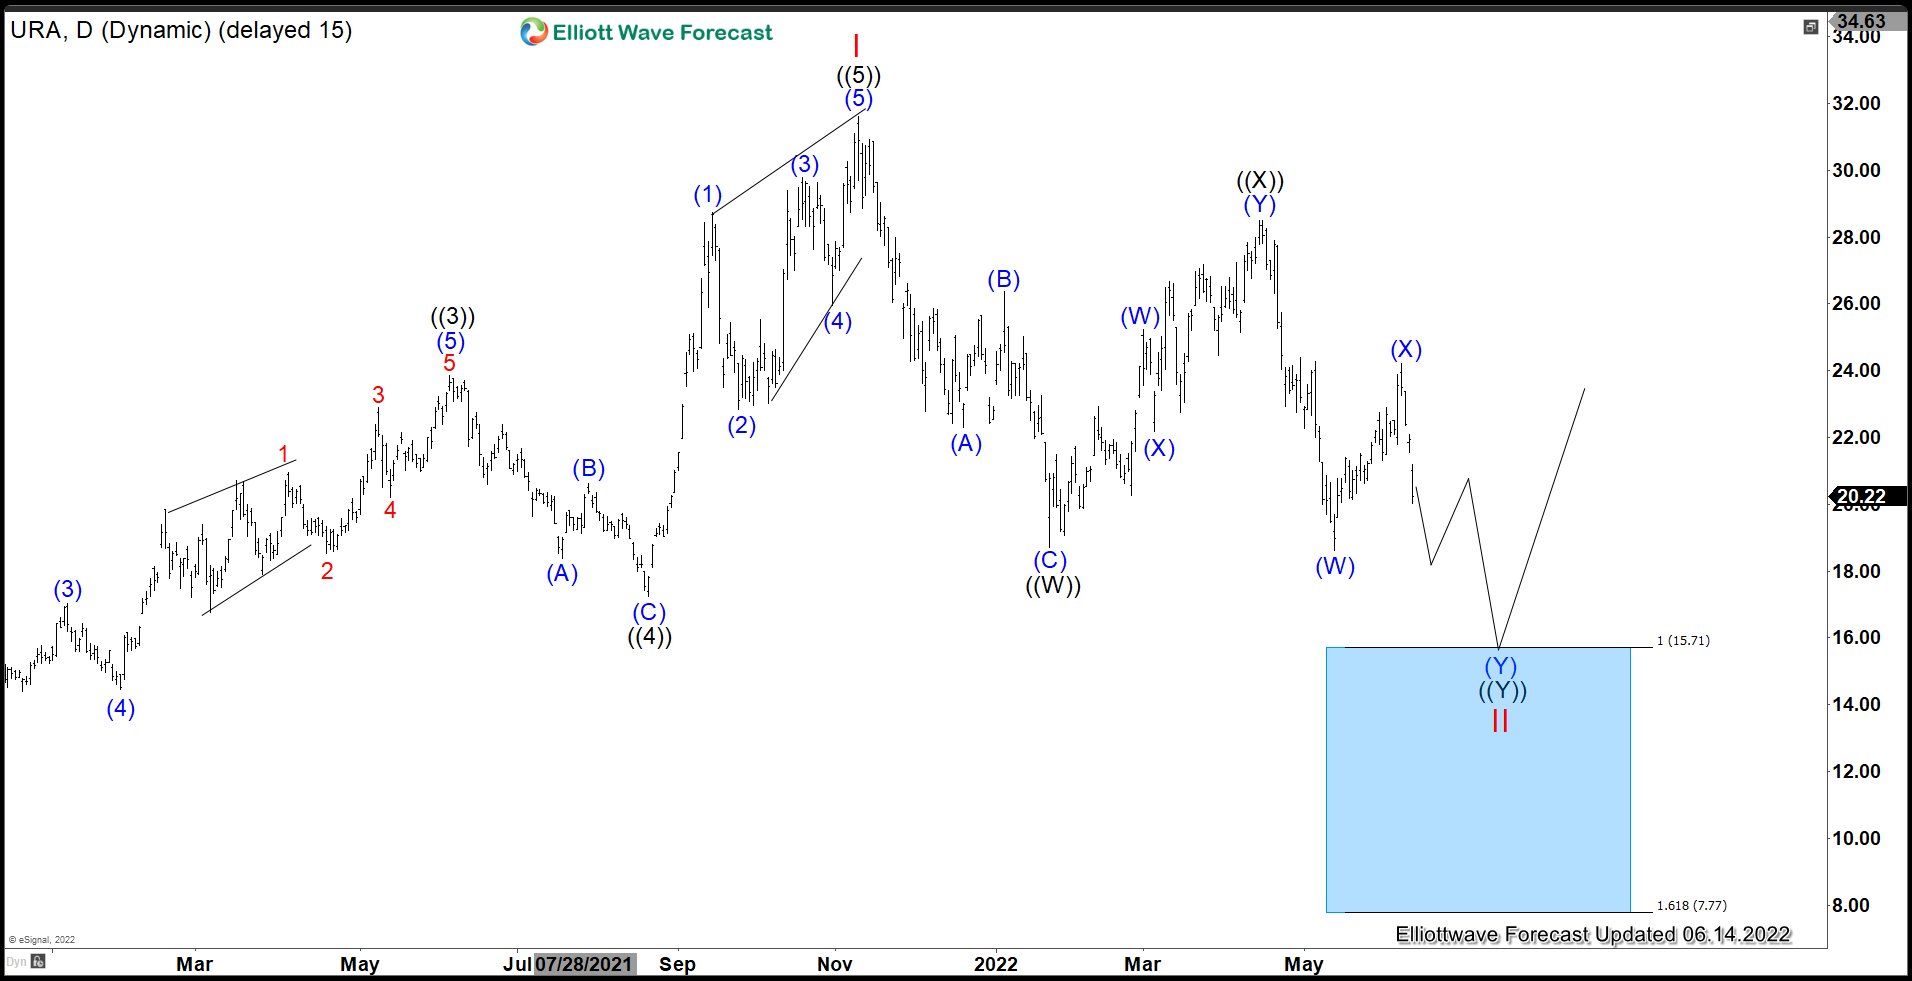
URA Daily Elliott Wave View above shows the rally from 3/1/2020 low to 31.6 ended wave I. Wave II pullback is currently in progress with internal subdivision as a double three. Down from wave I, wave ((W)) ended at 18.71 and rally in wave ((X)) ended at 28.49. Wave ((Y)) of II is now in progress to reach the 100% - 161.8% Fibonacci extension of wave ((W)) at 7.77 - 15.71 before the rally resumes again. Buyers should appear from the blue box area for further upside.