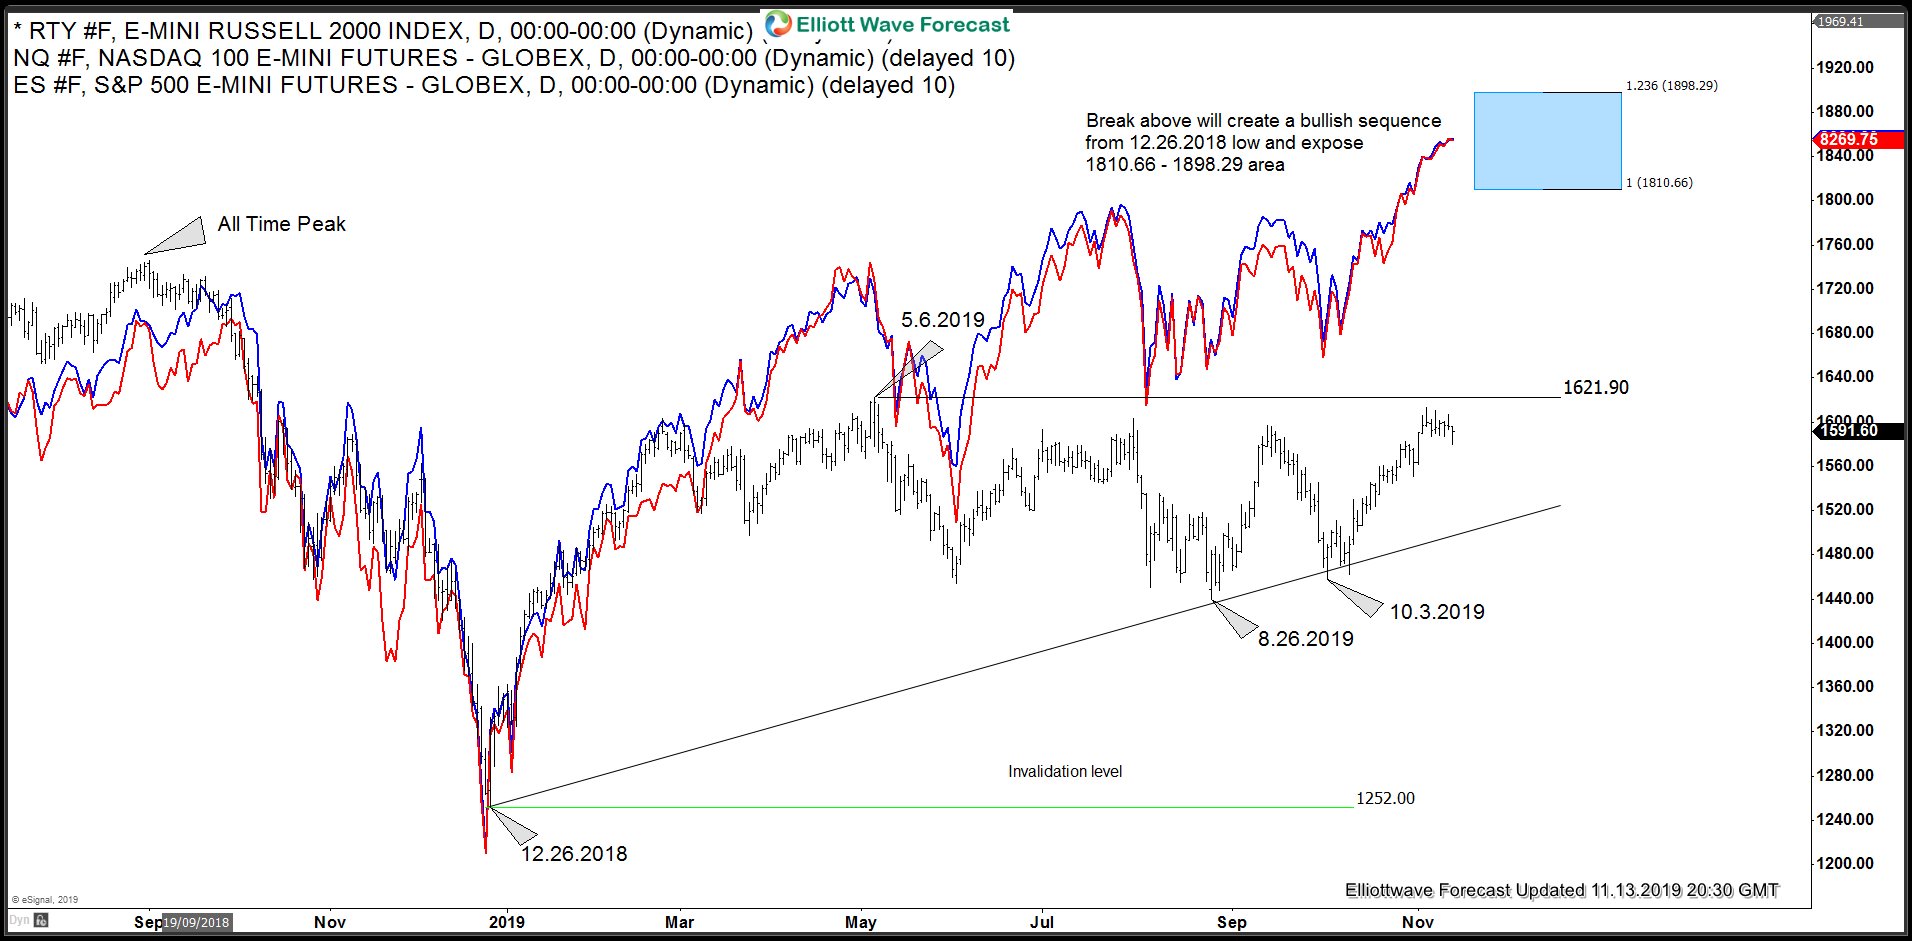
In the recent months, we have seen US Indices like $SPX $NQ_F $YM_F and $ES_F making new all time highs but Russell is the one which has been lagging and has not yet made a new high. It is on par in terms of percentage gains with other US Indices but has not made a new all time high and has not even made a new high above May 2019 peak yet. In this blog, we would take a look at whether it would follow other US Indices in breaking to new all time high and also highlight the key level it needs to break in order to make a break to new all time high more likely.
Russell Cycle from 12.26.2018 low
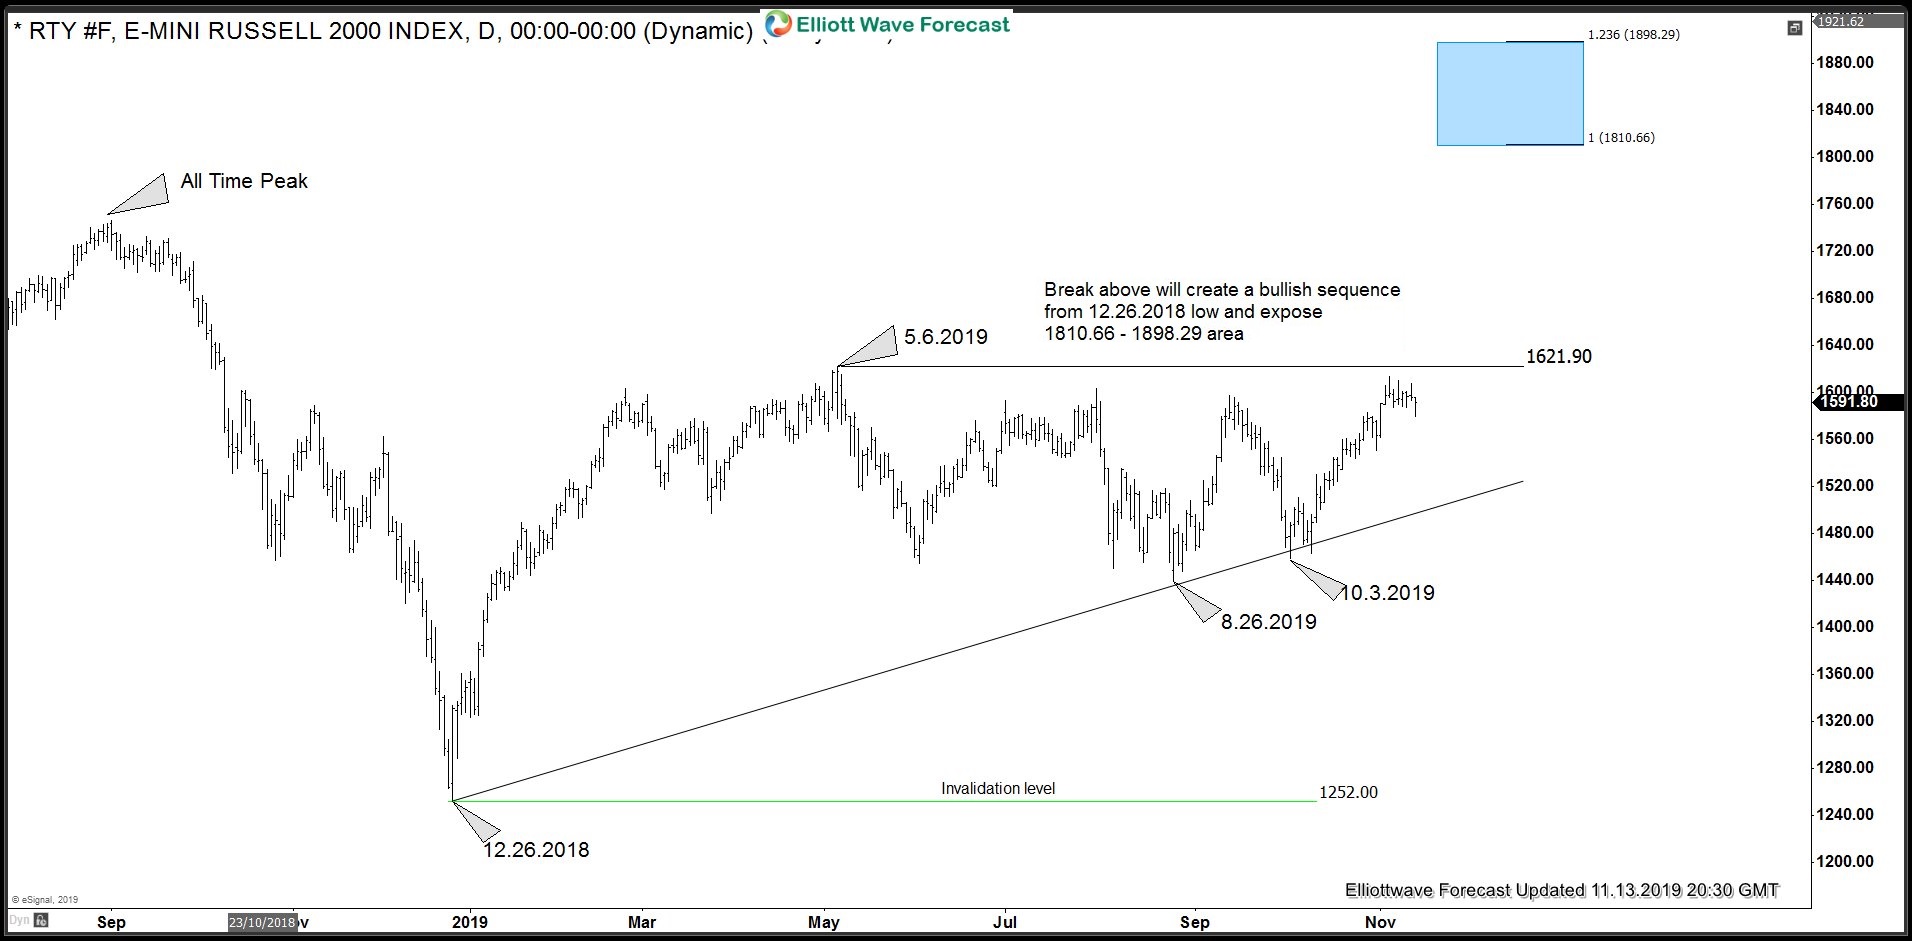
Chart below shows Russell put in a strong rally from 12.26.2018 low to 5.6.2019 peak which was follow by a 3 waves pull back to 8.26.2019 low. Since then, we have so far seen a 3 waves rally which has held just below 5.6.2019 peak. 100% Fibonacci extension of the rally from 8.26.2019 low comes at 1617.01 which is still below 5.6.2019 peak. However, ES_F and NQ_F have already made new all time highs and in addition, we have DAX and Eurostoxx already showing incomplete bullish sequences from 12.26.2018 low with more upside to come before they reach the minimum targets for the cycles from 12.26.2018 low which supports the idea of Russell Futures also extending higher.
5.6.2019 is the key level that Russell Futures need to break to open a move towards new all time highs. Break above 5.6.2019 low would create a bullish sequence from 12.26.2018 low and 1810.66 - 1898.29 would the ideal target area for the cycle from 12.26.2018 low to end. This is above the current all time peak and hence a break above 5.6.2019 peak would trigger a move to a new all time high.

Russell Futures overlay with NQ_F and ES_F
