USD/CAD Technical Analysis Summary
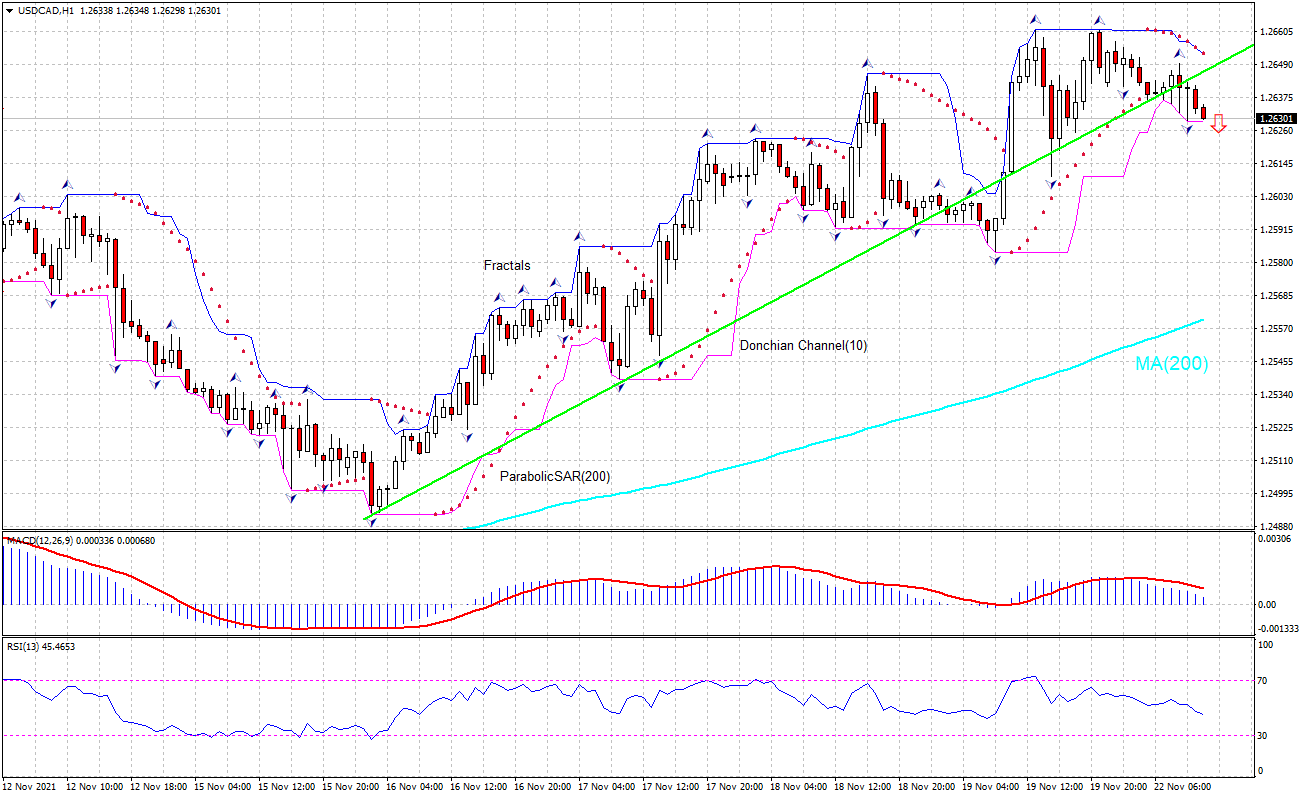
Sell Stop:Below 1.2629
Stop Loss:Above 1.2659
| Indicator | Signal |
|---|---|
| RSI | Neutral |
| MACD | Sell |
| Donchian Channel | Sell |
| MA(200) | Buy |
| Fractals | Sell |
| Parabolic SAR | Sell |
USD/CAD Chart Analysis
USD/CAD Technical Analysis
The technical analysis of the USDCAD price chart on 1-hour timeframe shows USDCAD: H1 has breached below the support line above the 200-perid moving average MA(200) which is rising still. We believe the bearish movement will continue after the price breaches below the lower bound of the Donchian channel at 1.2629. A level below this can be used as an entry point for placing a pending order to sell. The stop loss can be placed above 1.2659. After placing the order, the stop loss is to be moved to the next fractal high, following Parabolic signals. Thus, we are changing the expected profit/loss ratio to the breakeven point. If the price meets the stop loss level without reaching the order, we recommend cancelling the order: the market has undergone internal changes which were not taken into account.
Fundamental Analysis of Forex - USD/CAD
Canada’s retail sales decline was smaller than forecast in October. Will the USDCAD price continue falling?
Canada’s retail sales decline was smaller than forecast in October: Statistics Canada reported retail sales declined 0.6% over month in October after 1.8% increase in September, when a 1.6% drop was expected. This is bullish for USDCAD.