USD/CHF Technical Analysis Summary
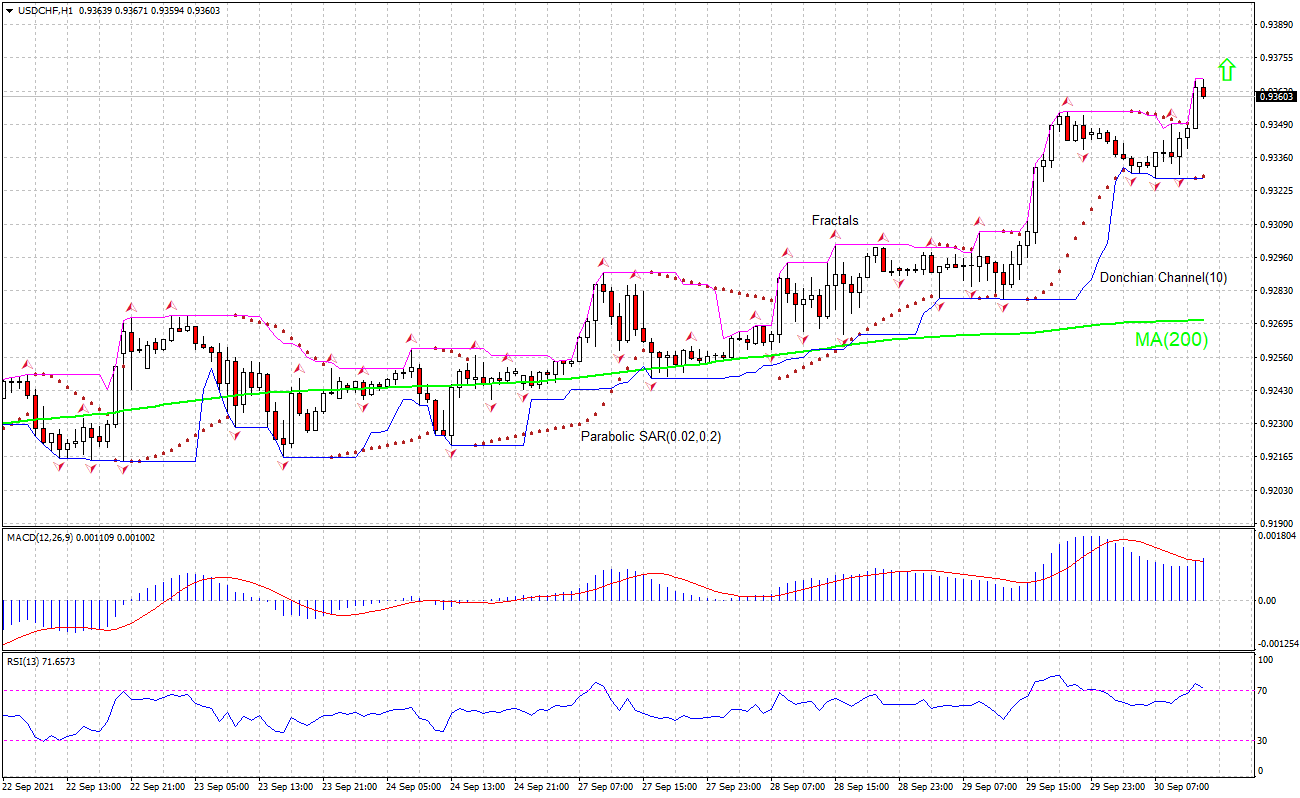
Buy Stop:Above 0.9367
Stop Loss:Below 0.9328
| Indicator | Signal |
|---|---|
| RSI | Sell |
| MACD | Buy |
| Donchian Channel | Neutral |
| MA(200) | Buy |
| Fractals | Buy |
| Parabolic SAR | Buy |
USD/CHF Chart Analysis
USD/CHF Technical Analysis
The technical analysis of the USDCHF price chart on daily timeframe shows USDCHF,Daily is retracing higher above the 200-period moving average MA(200) which is rising itselfe. We believe the bullish momentum will continue after the price breaches above the upper bound of the Donchian channel at 0.9367. A level above this can be used as an entry point for placing a pending order to buy. The stop loss can be placed below 0.9328. After placing the order, the stop loss is to be moved to the next fractal low indicator, following Parabolic signals. Thus, we are changing the expected profit/loss ratio to the breakeven point. If the price meets the stop loss level without reaching the order, we recommend cancelling the order: the market has undergone internal changes which were not taken into account.
Fundamental Analysis of Forex - USD/CHF
KOF economic index continued to decline in September for Switzerland. Will the USDCHF price advance continue?
The KOF Economic Research Agency reported its Economic Barometer index for Switzerland declined to 110.6 points in September from 113.5 in August. The continued decline was mainly attributed to declining foreign demand and manufacturing activity. Weaker performance of Swiss economy is bullish for USDCHF.