USD/CNH Technical Analysis Summary
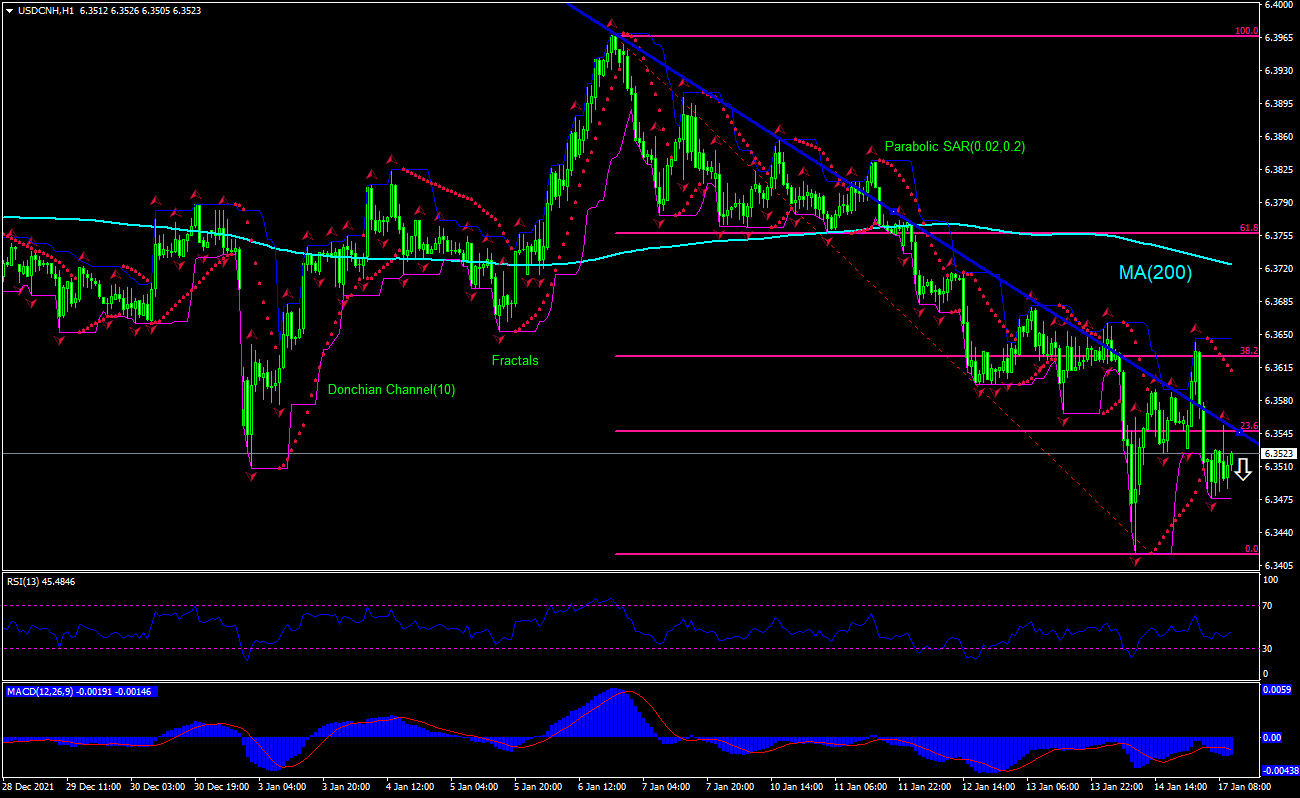
Sell Stop: Below 6.3476
Stop Loss: Above 6.3645
| Indicator | Signal |
|---|---|
| RSI | Neutral |
| MACD | Buy |
| Donchian Channel | Neutral |
| MA(200) | Sell |
| Fractals | Sell |
| Parabolic SAR | Sell |
USD/CNH Chart Analysis
USD/CNH Technical Analysis
The technical analysis of the USDCNH price chart on 1-hour timeframe shows USDCNH: H1 is retracing down after breaching above resistance, the 200-period moving average MA(200) is declining. We believe the bearish movement will continue after the price breaches below the lower bound of the Donchian channel at 6.3476. A level below this can be used as an entry point for placing a pending order to sell. The stop loss can be placed above 6.3645. After placing the order, the stop loss is to be moved to the next fractal high, following Parabolic signals. Thus, we are changing the expected profit/loss ratio to the breakeven point. If the price meets the stop loss level without reaching the order, we recommend cancelling the order: the market has undergone internal changes which were not taken into account.
Fundamental Analysis of Forex - USD/CNH
China’s industrial production rose in December. Will the USDCNH price retreating persist?
China’s industrial production rose in December: the National Bureau of Statistics of China reported industrial output growth accelerated to 4.3% over year in December from 3.8% in October when a decrease to 3.7% was expected. This is bearish for USDCNH.