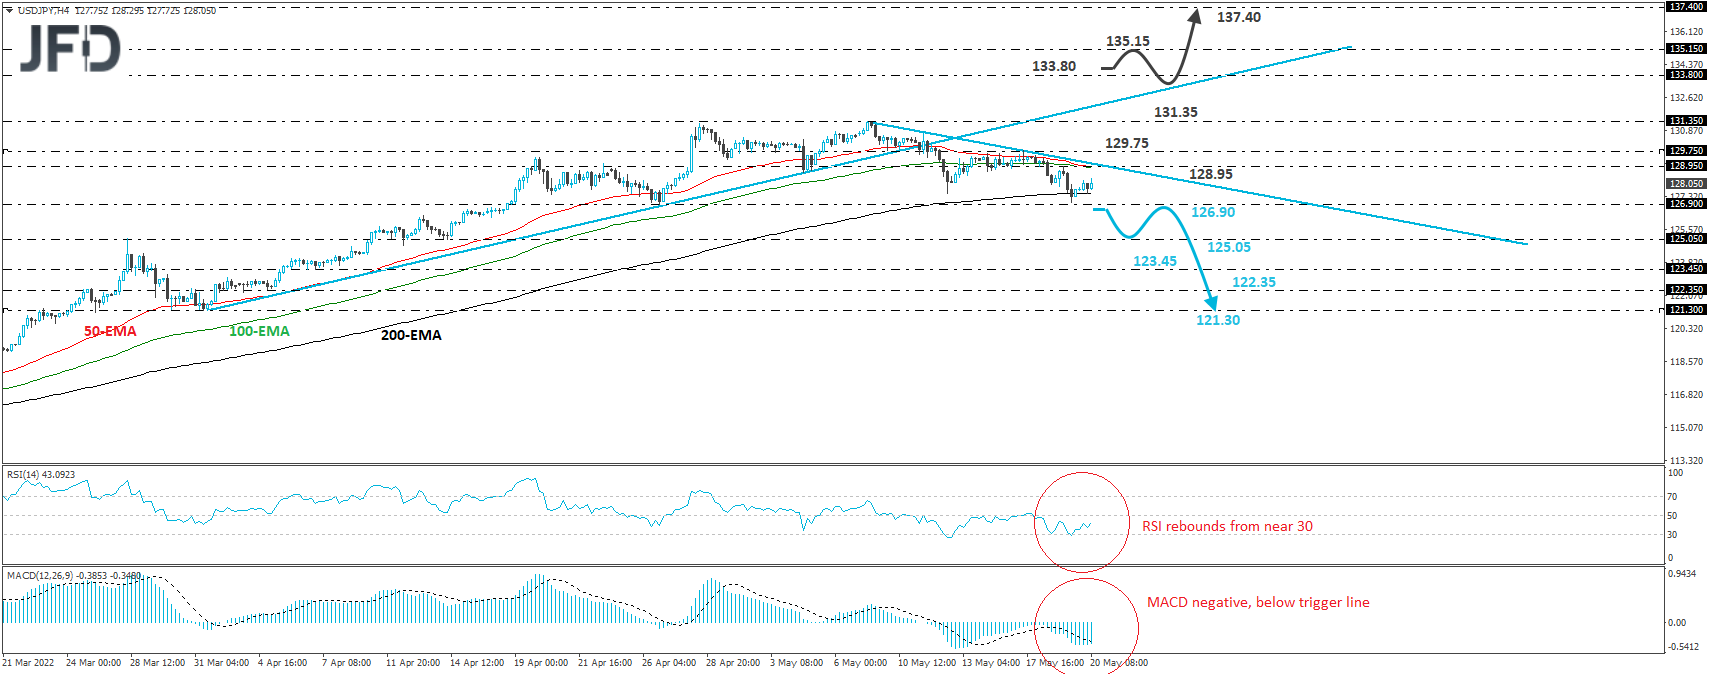
USD/JPY traded lower yesterday after hitting resistance at 128.95. However, the rate hit support near 126.90, marked by the low of April 26th, and then it rebounded somewhat. Overall, the pair remains below the prior upside line taken from the low of March 31st, as well as below a shorter-term downside line, taken from the high of May 9th. In our view, this paints a negative short-term picture.
We would expect the bears to take charge again at some point soon, and perhaps overcome the 126.90 zone. This could carry extensions towards the 123.45 level, marked by the low of April 6th, or the 122.35 barrier, defined by the low of April 5th. If neither barrier is able to stop the slide, then we could see a test near the 121.30 barrier, which provided strong support on March 30th and 31st.
Taking a look at our short-term oscillators, we see that the RSI rebounded from near its 30 line, while the MACD, although below both its zero and trigger lines, shows signs of bottoming as well. Both indicators detect slowing downside speed and suggest that some further recovery may be looming before the next leg south.
On the upside, we would like to see a clear recovery back above the pre-discussed upside line and the 133.80 zone before we get confident that the bulls have stolen all the bears’ swords. This could initially aim for the 135.15 zone, which provided strong support back in January and February 2002, and if it gets broken, we could experience extensions towards the high of September 1998, at around 137.40.
Disclaimer:
The content we produce does not constitute investment advice or investment recommendation (should not be considered as such) and does not in any way constitute an invitation to acquire any financial instrument or product. The Group of Companies of JFD, its affiliates, agents, directors, officers or employees are not liable for any damages that may be caused by individual comments or statements by JFD analysts and assumes no liability with respect to the completeness and correctness of the content presented. The investor is solely responsible for the risk of his investment decisions. Accordingly, you should seek, if you consider appropriate, relevant independent professional advice on the investment considered. The analyses and comments presented do not include any consideration of your personal investment objectives, financial circumstances or needs. The content has not been prepared in accordance with the legal requirements for financial analyses and must therefore be viewed by the reader as marketing information. JFD prohibits the duplication or publication without explicit approval.
CFDs are complex instruments and come with a high risk of losing money rapidly due to leverage. 72.99% of retail investor accounts lose money when trading CFDs with the Company. You should consider whether you understand how CFDs work and whether you can afford to take the high risk of losing your money. Please read the full Risk Disclosure.
Copyright 2022 JFD Group Ltd.