JPY crosses diverge as USD/JPY bulls eye 149 ahead of US CPI, while CAD/JPY and CHF/JPY signal potential bearish continuation.
By : Matt Simpson, Market Analyst
JPY crosses are showing mixed momentum ahead of this week’s key risk events. USD/JPY is extending gains toward the 149.00 handle before the US CPI release, supported by broad US dollar strength. In contrast, CAD/JPY and CHF/JPY are flashing bearish continuation signals despite recent Japanese yen weakness — suggesting that a shift toward yen strength could accelerate declines. Technical setups across all three pairs point to pivotal levels that may shape the near-term trend.
View related analysis:
- AUD/USD Weekly Outlook: RBA Set for Cautious Cut as US CPI Looms
- USD, GBP/USD, VIX, WTI Crude Oil: Commitment of Traders (COT) Analysis
- USD/JPY, GBP/JPY Outlook: Trump Eyes Fed Shakeup, BOE Rattle Pound Bears
- AUD/JPY, CAD/JPY and ASX 200 Technical Setups: Key Levels in Focus
USD/JPY Rises Ahead of CPI, CAD/JPY and CHF/JPY Bearish Against Japanese Yen
I expect the RBA to cut rates today by 25bp. Failure to do so — when that is the market consensus — would likely trigger a broad bounce higher for the Australian dollar. Conversely, downside may be limited if the RBA cuts but avoids providing any meaningful forward guidance for further easing in its updated forecasts. My base case remains for a 25bp cut, with the RBA leaving the door open for one more reduction by December, while — as usual — citing caution on the economic outlook.
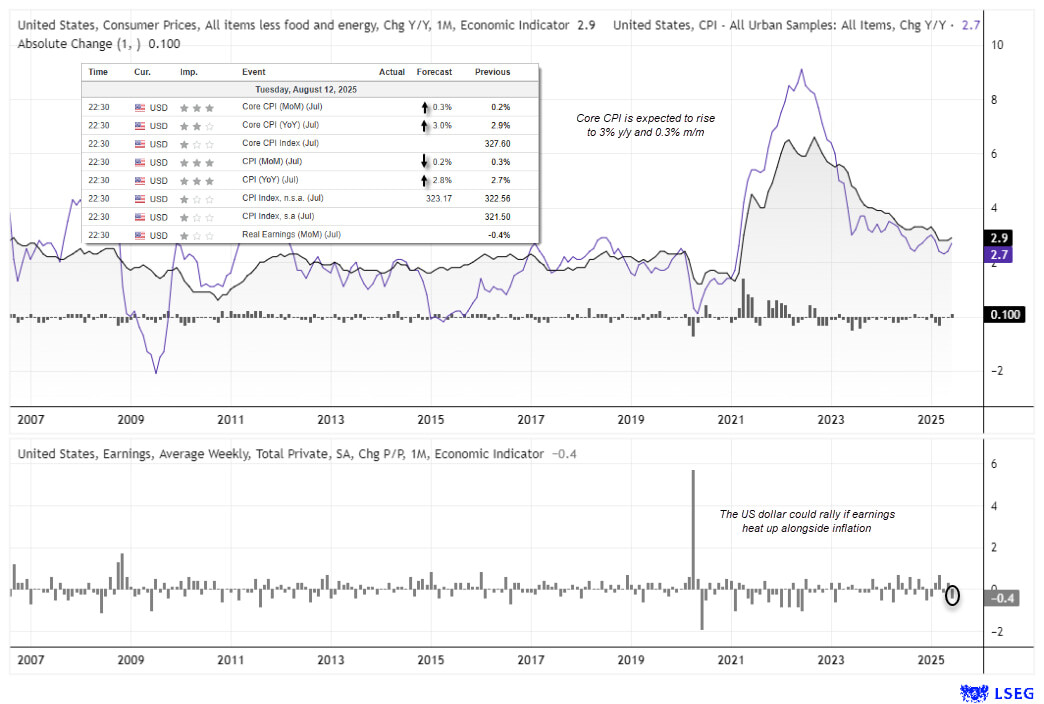
Focus now shifts to US CPI data, where core inflation is expected to rise to 3.0% y/y and 0.3% m/m. The US dollar could strengthen if this is accompanied by higher earnings — and even more so if CPI prints at 3.1% y/y, 0.4% m/m or above. Such an outcome would support Jerome Powell’s stance and reduce expectations for September and December rate cuts. However, with higher inflation already priced in, traders should also be prepared for a downside surprise — which could trigger a sharper, more volatile move lower in the US dollar.
USD/JPY Technical Analysis: US Dollar vs Japanese Yen
Last week, I outlined a potential scenario for USD/JPY to rise temporarily above its 200-day EMA and form a lower high, as part of a possible head and shoulders top pattern, before breaking lower. That first stage is now underway, with a two-day rally in the US dollar–Japanese yen pair pushing prices above the 200-day EMA. A hotter-than-expected US inflation print could fuel further upside in USD/JPY over the near term, potentially testing resistance near 149.00.
If prices fail to break above the resistance zone just beyond 149, the focus will shift to a potential lower high — forming the ‘right shoulder’ (RS) of the head and shoulders pattern. While near-term momentum may favour the US dollar, the broader bias suggests that once this corrective move ends, USD/JPY could turn lower as the US dollar resumes its downtrend against the Japanese yen.
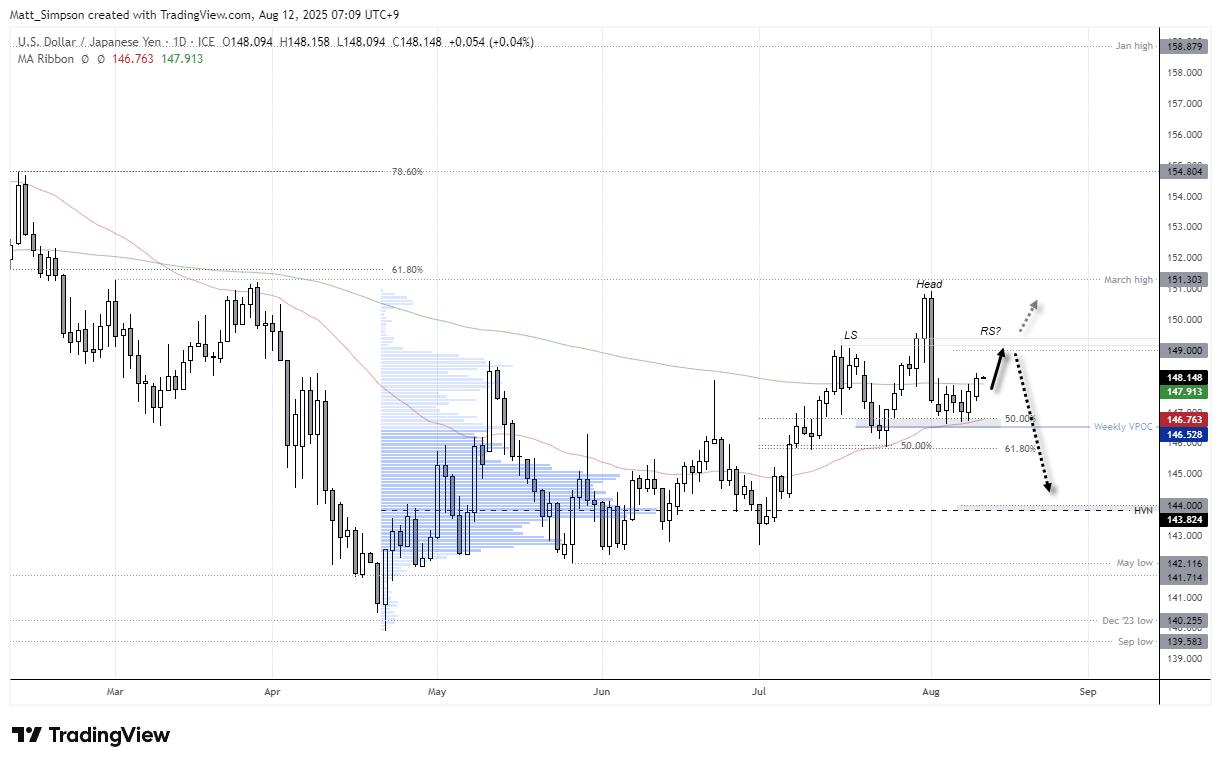
Chart analysis by Matt Simpson - data source: TradingView USD/JPY
Click the website link below to read our exclusive Guide to USD/JPY trading in Q2 2025
https://www.cityindex.com/en-au/market-outlooks-2025/q2-usd-jpy-outlook/

CAD/JPY Technical Analysis: Canadian Dollar vs Japanese Yen
I was watching CAD/JPY last week with a potential short bias, while noting the risk of a bounce from trendline support first. One week later, the Canadian dollar–Japanese yen cross has posted only a lacklustre rebound from that support, and CAD/JPY bears may now be closer to getting their way. The Canadian dollar has been one of the weaker performers against the Japanese yen over the past week, despite broad yen weakness. If the Japanese yen strengthens more broadly, CAD/JPY could fall further than many other major currency pairs.
CAD/JPY remains pinned along trendline support, with Monday’s price action failing to break above Friday’s small bullish engulfing candle. The monthly pivot point is capping gains, and while a brief pop higher after the Tokyo open is possible, the elongated bearish engulfing candle at the cycle high just below 109 keeps the bearish outlook in focus.
A drop towards 106.00 could be a viable target for CAD/JPY bears, as it aligns with a high-volume node (HVN) from a prior correction. A break below that level would bring the 105.00 handle into view, just above the 104.80 swing low — further cementing the Canadian dollar’s weakness against the Japanese yen.
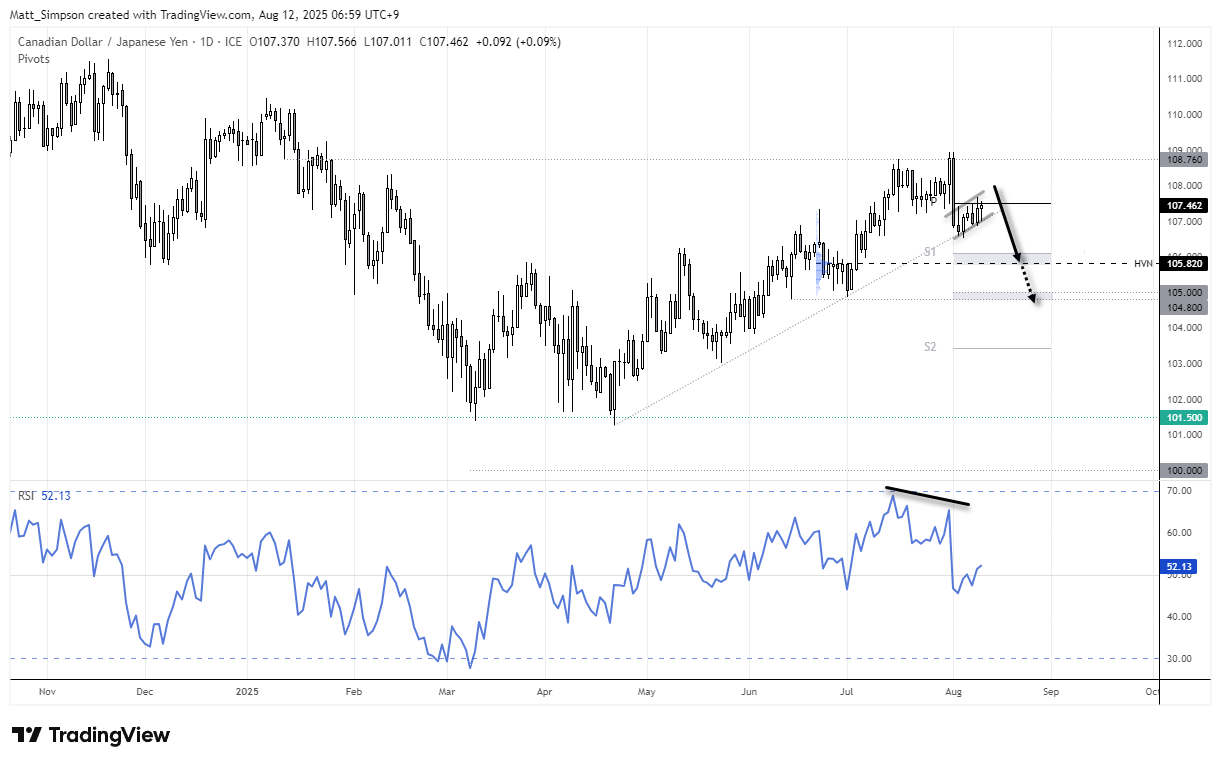
Chart analysis by Matt Simpson - data source: TradingView CAD/JPY
CHF/JPY Technical Analysis: Swiss Franc vs Japanese Yen
The Swiss franc has enjoyed a strong rally against the Japanese yen, with CHF/JPY climbing over 12% from the February low to the July high. Aside from a brief consolidation in a pennant formation on the weekly chart, pullbacks have been scarce — until now.
Last month’s rejection at the 186.00 level formed a double top, hinting at a shift in momentum. A modest 38.2% Fibonacci retracement of the February–July rally projects a possible dip below the 179.00 handle, aligning with June’s value area high (VAH).
Click the website link below to read our Guide to central banks and interest rates in Q2 2025
https://www.cityindex.com/en-au/market-outlooks-2025/q2-central-banks-outlook/

CHF/JPY: Daily Chart Signals Deeper Pullback Risk
On the daily timeframe, CHF/JPY failed to hold above 186.00, forming a lower high and a sharp bearish engulfing candle. Price is currently consolidating above the monthly S1 pivot at 182.21, but the emerging bear flag pattern suggests potential continuation lower.
The measured move target from the bear flag aligns just above 179.00, making it a key level for bearish traders. However, downside momentum may stall near 180.22 — the 2024 high — which could act as a support pivot before any further decline.
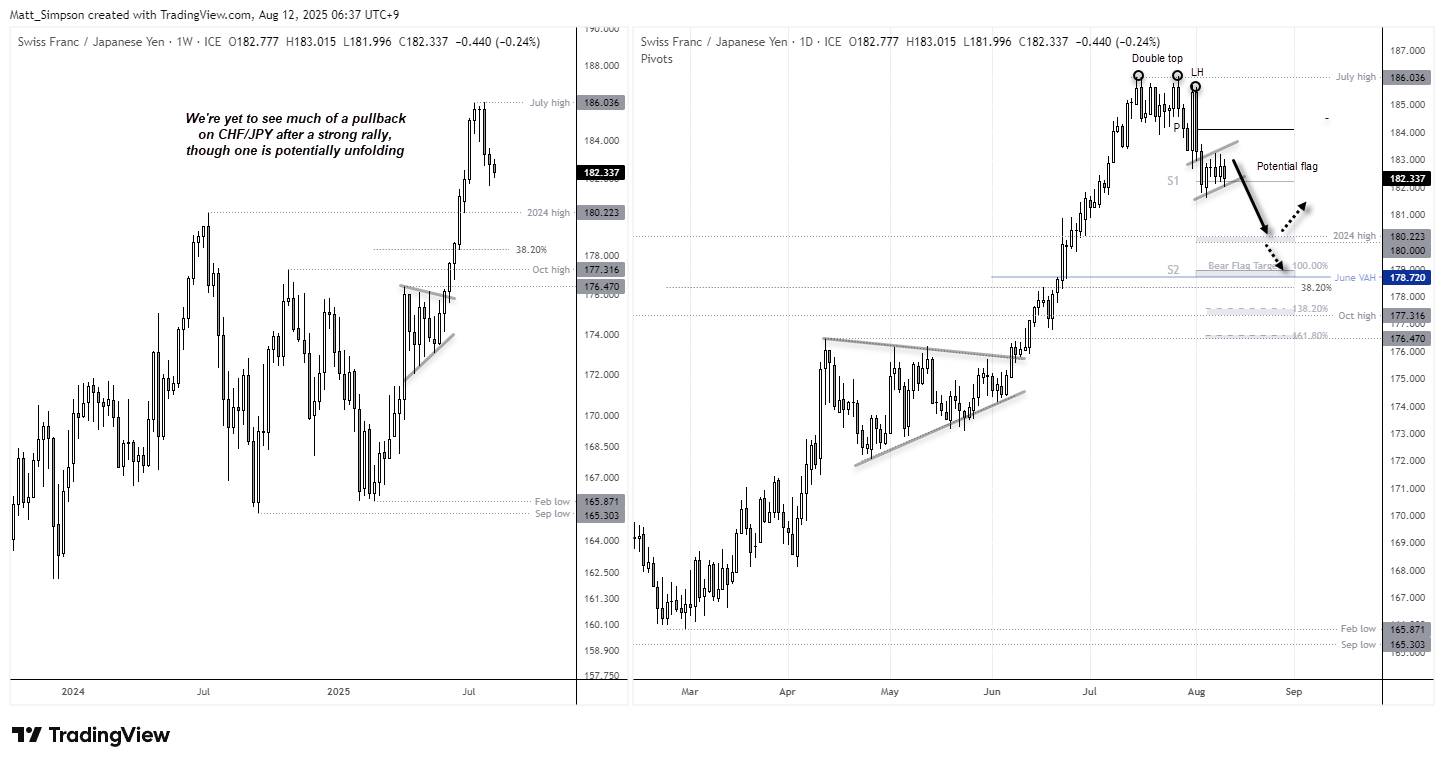
Chart analysis by Matt Simpson - data source: TradingView CHF/JPY
View the full economic calendar
– Written by Matt Simpson
Follow Matt on Twitter u/cLeverEdge
From time to time, StoneX Financial Pty Ltd (“we”, “our”) website may contain links to other sites and/or resources provided by third parties. These links and/or resources are provided for your information only and we have no control over the contents of those materials, and in no way endorse their content. Any analysis, opinion, commentary or research-based material on our website is for information and educational purposes only and is not, in any circumstances, intended to be an offer, recommendation or solicitation to buy or sell. You should always seek independent advice as to your suitability to speculate in any related markets and your ability to assume the associated risks, if you are at all unsure. No representation or warranty is made, express or implied, that the materials on our website are complete or accurate. We are not under any obligation to update any such material.
As such, we (and/or our associated companies) will not be responsible or liable for any loss or damage incurred by you or any third party arising out of, or in connection with, any use of the information on our website (other than with regards to any duty or liability that we are unable to limit or exclude by law or under the applicable regulatory system) and any such liability is hereby expressly disclaimed.