USD/JPY Technical Analysis Summary
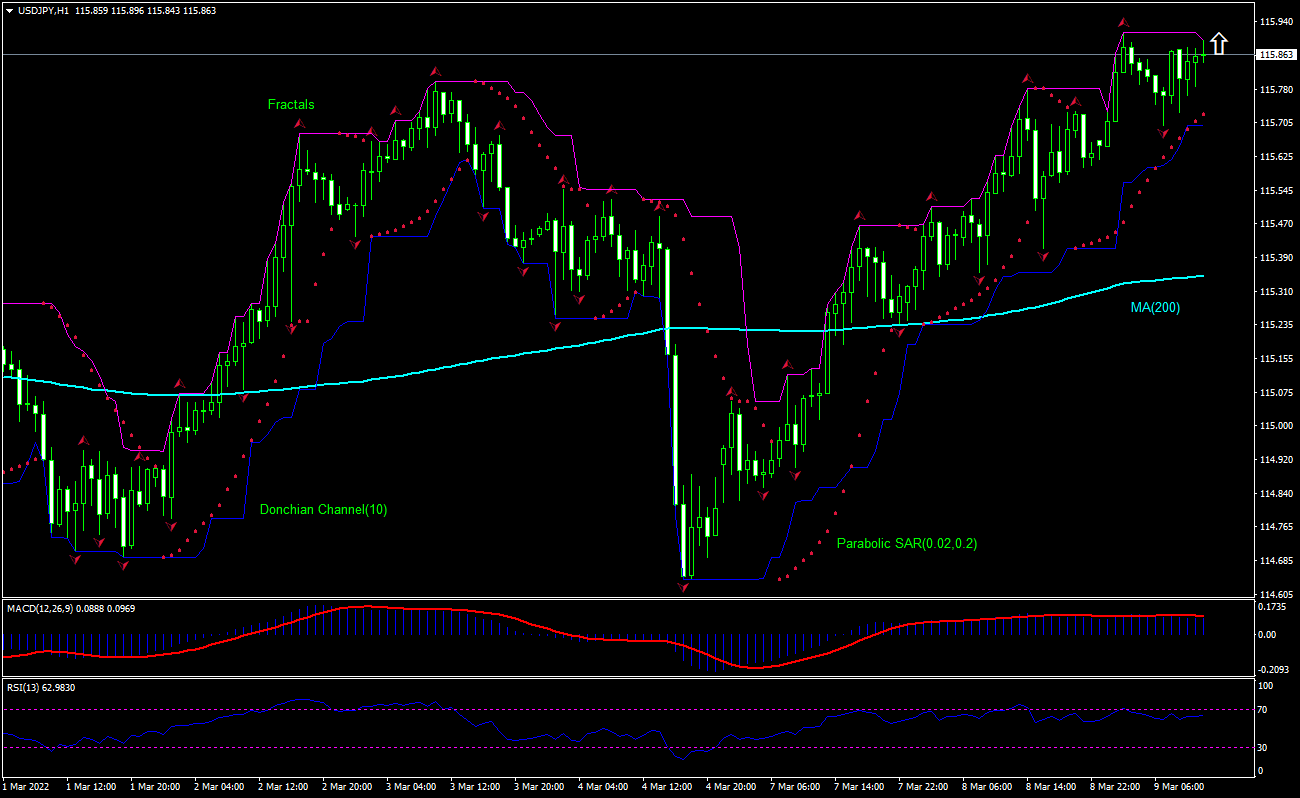
Buy Stop: Above 115.90
Stop Loss: Below 115.68
| Indicator | Signal |
|---|---|
| RSI | Neutral |
| MACD | Neutral |
| Donchian Channel | Sell |
| MA(200) | Buy |
| Fractals | Buy |
| Parabolic SAR | Buy |
USD/JPY Chart Analysis
USD/JPY Technical Analysis
The USDJPY technical analysis of the price chart on 1-hour timeframe shows USDJPY: H1 is climbing after breaching above the 200-period moving average MA(200) which is rising itself. We believe the bullish movement will continue after the price breaches above the upper bound of the Donchian channel at 115.90. A level above this can be used as an entry point for placing a pending order to buy. The stop loss can be placed below 115.68. After placing the order, the stop loss is to be moved to the next fractal low indicator, following Parabolic signals. Thus, we are changing the expected profit/loss ratio to the breakeven point. If the price meets the stop loss level without reaching the order, we recommend cancelling the order: the market has undergone internal changes which were not taken into account.
Fundamental Analysis of Forex - USD/JPY
Japan’s machine tool orders growth slowed in February. Will the USDJPY price climbing continue?
Japan’s machine tool orders growth slowed in February: the Japan Machine Tool Builders Association reported machine tool orders rose 31.6% over year in February after 61.4% growth in March. This is bullish for USDJPY.