We’ve seen a slight recovery in the US dollar, but this is to be expected following such a sharp selloff heading into the weekend. But we’re also seeing the obligatory hawkish pushback from Fed speakers this week, as they try to steer market expectations away from rate cuts.
So there’s risk we could see further US dollar strength today assuming Powell and co continue to remind markets of their ‘higher for longer’ narrative. But at best it may prompt further short covering for the dollar – as that is what I believe we’ve seen so far this week. Ultimately, bonds are the bigger story. And if yields continue to retrace, it seems just a matter of time before the dollar points south again.
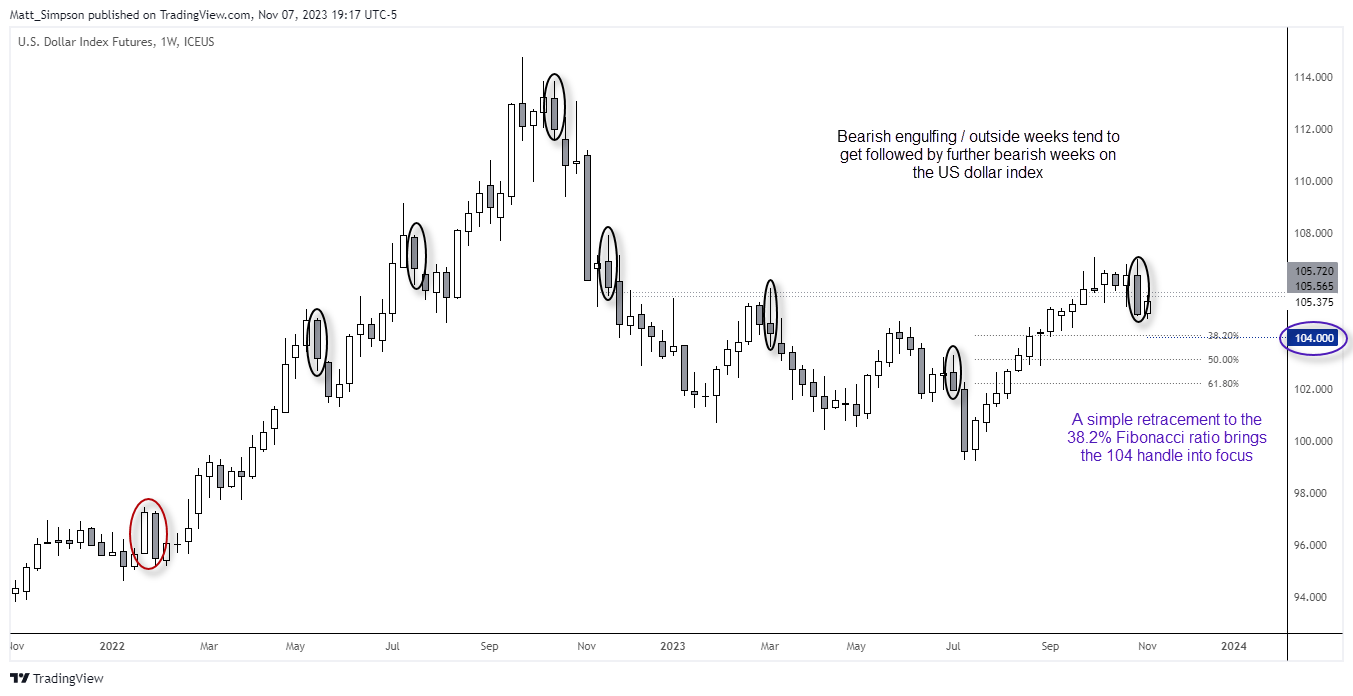
US dollar index technical analysis (weekly chart):
The dollar index (DXY) formed a bearish engulfing week by Friday’s close, and if recent history is anything to go by they tend not to come in isolation and can mark the beginning of corrections. Given the strong runup towards 106 and multi-week pause, a pullback from these levels seems very plausible.
Prices have retraced against last week’s move to a degree, but it clearly lacks bullish legs. And if we are to see a simple retracement towards the 38.2% Fibonacci level, it brings the 104 handle into focus at a minimum.
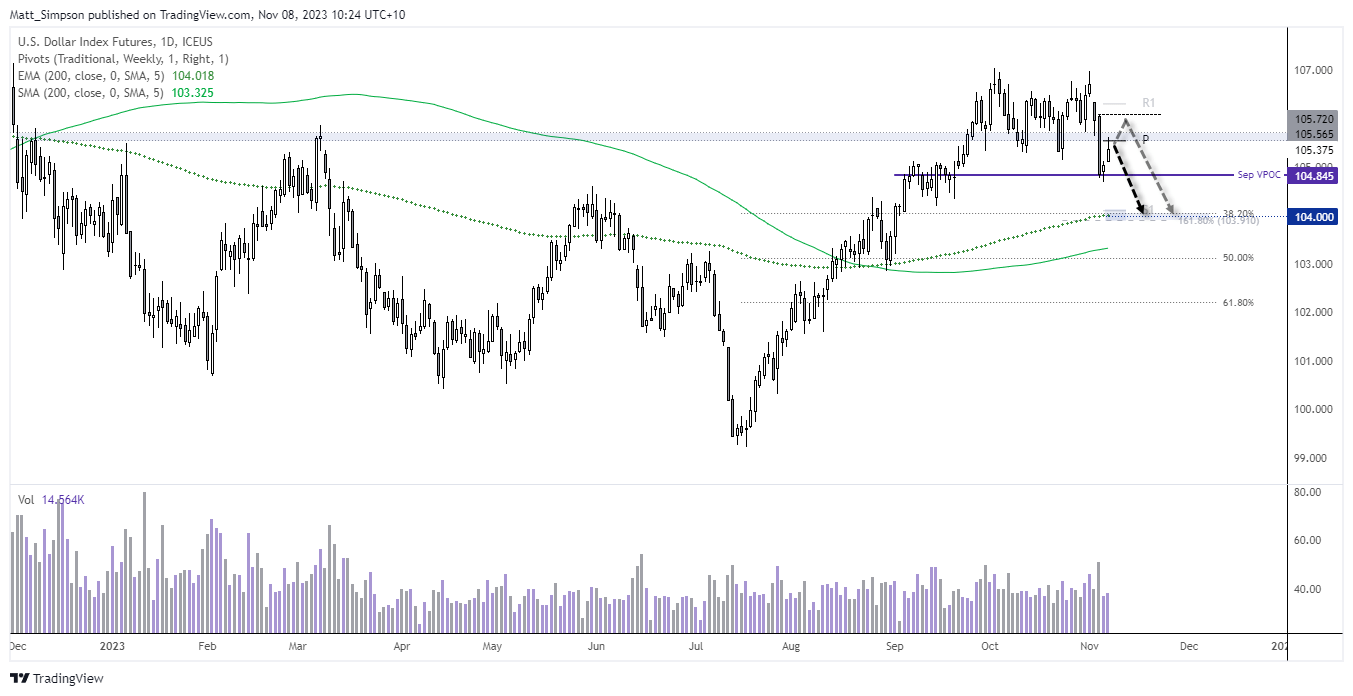
US dollar index technical analysis (daily chart):
The daily DXY chart shows that the past two ‘bullish’ days have lacked the volatility of Friday’s selloff, hence the hunch it is a short-covering really. Support was also found at the September VPOC (volume point of control). However, an upper wick formed on Tuesday which respected the weekly pivot point to show a hesitancy to continue higher. There is also a zone of resistance around 105.60 being respected, so if Fed members fail to convince markets that Friday’s bearish day was wrong, bears may be waiting on the sidelines to short the US dollar. Obviously, lower bond yields would help weigh on the dollar.
- Bears could seek to enter short around current levels of yesterday’s highs with a stop above Friday’s high.
- A break beneath Monday’s low assumes bearish continuation
- Initial downside target is 104, near the 200-day EMA, S1 weekly pivot and 161.8% Fibonacci ratio.
From time to time, StoneX Financial Pty Ltd (“we”, “our”) website may contain links to other sites and/or resources provided by third parties. These links and/or resources are provided for your information only and we have no control over the contents of those materials, and in no way endorse their content. Any analysis, opinion, commentary or research-based material on our website is for information and educational purposes only and is not, in any circumstances, intended to be an offer, recommendation or solicitation to buy or sell. You should always seek independent advice as to your suitability to speculate in any related markets and your ability to assume the associated risks, if you are at all unsure. No representation or warranty is made, express or implied, that the materials on our website are complete or accurate. We are not under any obligation to update any such material.
As such, we (and/or our associated companies) will not be responsible or liable for any loss or damage incurred by you or any third party arising out of, or in connection with, any use of the information on our website (other than with regards to any duty or liability that we are unable to limit or exclude by law or under the applicable regulatory system) and any such liability is hereby expressly disclaimed.