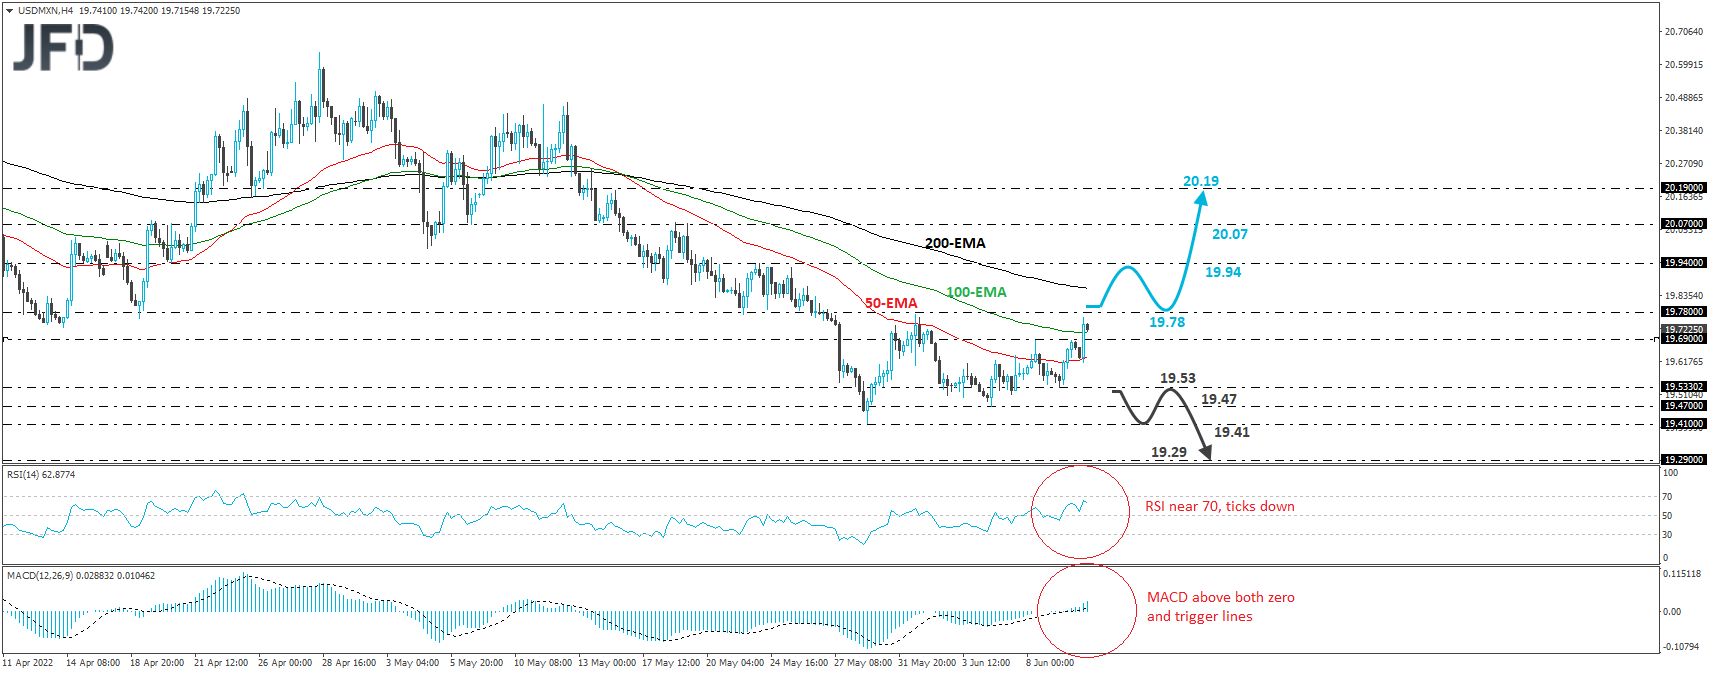
USD/MXN trade higher today during the European morning, breaking above the 19.69 barrier, marked by the highs of June 8th and 9th. Given that the pair has already printed a higher low on the daily chart, marked by the low of June 6th, we would see decent chances for the rate to complete a bullish reversal soon.
In our view, this will happen upon a break above 19.78, marked by the high of June 1st. The bulls could then get encouraged to push the action towards the 19.94 barrier, defined as a resistance by the high of May 24th, where another break could extend the advance towards the 20.07 area, marked by the highs of May 18th and 19th.
Shifting attention to our short-term oscillators, we see that the RSI got closer to its 70 line, but turned down, while the MACD remains above both its zero and trigger lines. Both indicators detect upside speed, which supports the notion for further advances, but the fact that the RSI ticked down makes us careful over a possible setback before the next leg north.
On the downside, we would like to see a clear dip below 19.53 before we totally abandon the bullish case. This could initially aim for the low of June 6th, at 19.47, or the low of May 30th, at 19.41. O break lower would take the rater into territories last seen in 2020, with the next support perhaps being the 19.29 level, marked by the inside swing high of February 24th of that year.
Disclaimer:
The content we produce does not constitute investment advice or investment recommendation (should not be considered as such) and does not in any way constitute an invitation to acquire any financial instrument or product. The Group of Companies of JFD, its affiliates, agents, directors, officers or employees are not liable for any damages that may be caused by individual comments or statements by JFD analysts and assumes no liability with respect to the completeness and correctness of the content presented. The investor is solely responsible for the risk of his investment decisions. Accordingly, you should seek, if you consider appropriate, relevant independent professional advice on the investment considered. The analyses and comments presented do not include any consideration of your personal investment objectives, financial circumstances or needs. The content has not been prepared in accordance with the legal requirements for financial analyses and must therefore be viewed by the reader as marketing information. JFD prohibits the duplication or publication without explicit approval.
CFDs are complex instruments and come with a high risk of losing money rapidly due to leverage. 72.99% of retail investor accounts lose money when trading CFDs with the Company. You should consider whether you understand how CFDs work and whether you can afford to take the high risk of losing your money. Please read the full Risk Disclosure.
Copyright 2022 JFD Group Ltd.