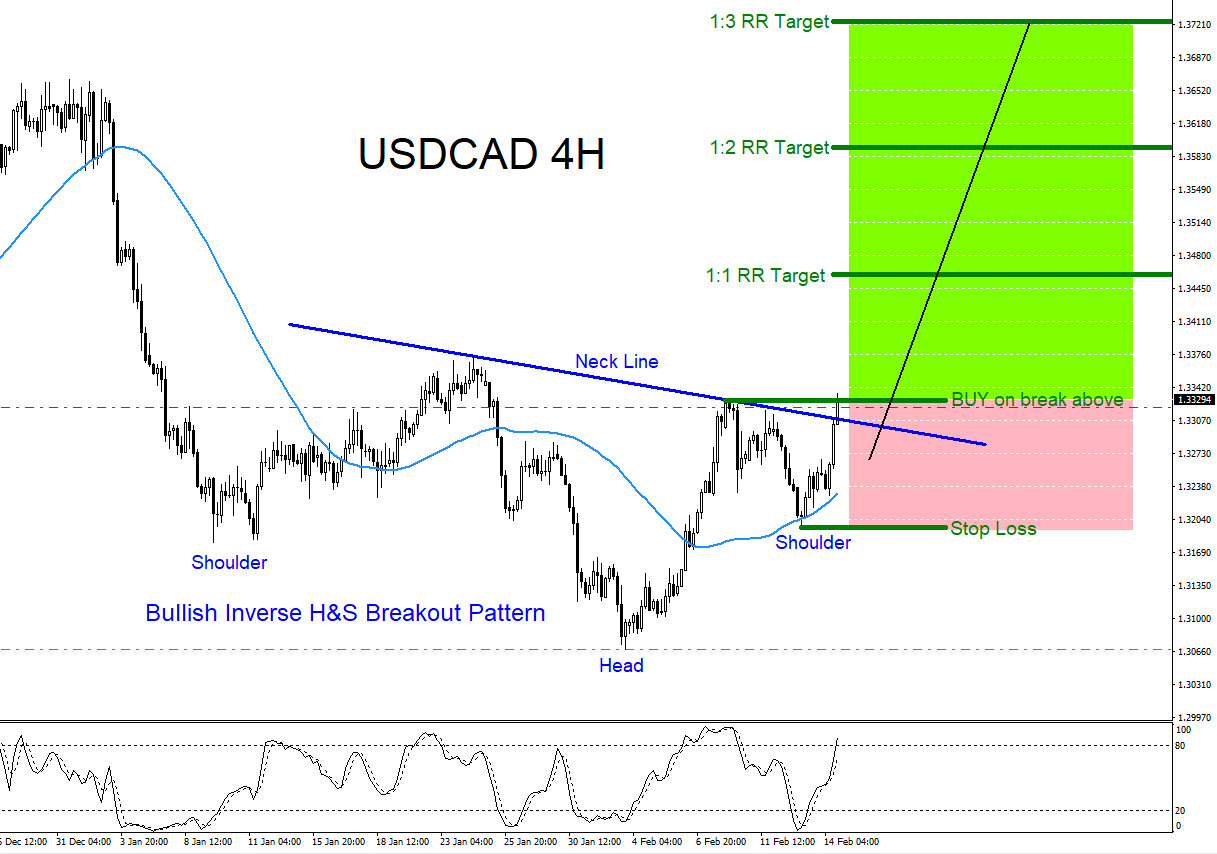
USDCAD BUY/LONG Trade Setup: USDCAD is forming a bullish inverted Head and Shoulders market breakout pattern. Price has already broke above the neck line which can be a signal that possibly more bulls will be entering LONGS and will start pushing the pair higher. Traders should watch for a good strong break above the green BUY breakout trend line. A good break above this level can send USDCAD higher and possibly extend to newer highs above the December 2018 high. If looking to BUY USDCAD look to buy on a good break above the green BUY entry trend line with Stop Loss at the low of the right shoulder and watching for price to hit the target levels as shown in the chart below. As long as the low of the right shoulder holds then a rally higher can be strongly possible. A break above the January 24/2019 high will confirm bulls are in control. Only time will tell what the pair will do but as for now I remain bullish until otherwise. Trade what you see and squeeze the trigger if and when you see USDCAD start to move higher. Trade safe.
USDCAD 4 Hour Chart 2.14.2019
Of course, like any strategy/technique, there will be times when the strategy/technique fails so proper money/risk management should always be used on every trade. Hope you enjoyed this article.
Dollar seems to be strength now so this pair started looking higher on its back. Also some analytics are saying that more traders will be entering the market for long term trading and this will boost the pair higher as well. But I agree with you that this is a matter of proper risk strategy anyway.
Very good bullish bounce on the USDCAD from the 200 day EMA at the 1.3176 level. The pair reaches the 1.3229 level, but it may find some resistance around the 1.3333 level. Below the 200 day EMA, it next support could be the 1.3000 level.
Further to this. Using quarters theory… depending how Monday opens, Friday’s close was under the 1.3225. This to me looks like a retest after the downward spike on Friday(20th). If this price stays between 1.32 and 1.3225 next week, you have a giant monthly hammer/shooting star. Are we still looking up? From 18/06/2019[d/m/y] to now I’m also seeing the highs capped by a downward trend, hence why I don’t think it will break 1.3225.
Hi… will need to wait end of the month to see if the candlestick pattern forms. As of right now, on the daily chart, as long as 1.3381 September 2019 high holds the pair can still make another swing low below 1.2950. Only time will tell and need to patient to see which side it wants to move.
The USDCAD just keeps getting higher as oil keeps falling. The pair reaches the 1.3464 level for the first time since June of 2019. The 1.3500 level may act as resistance and the 1.3400 as support.