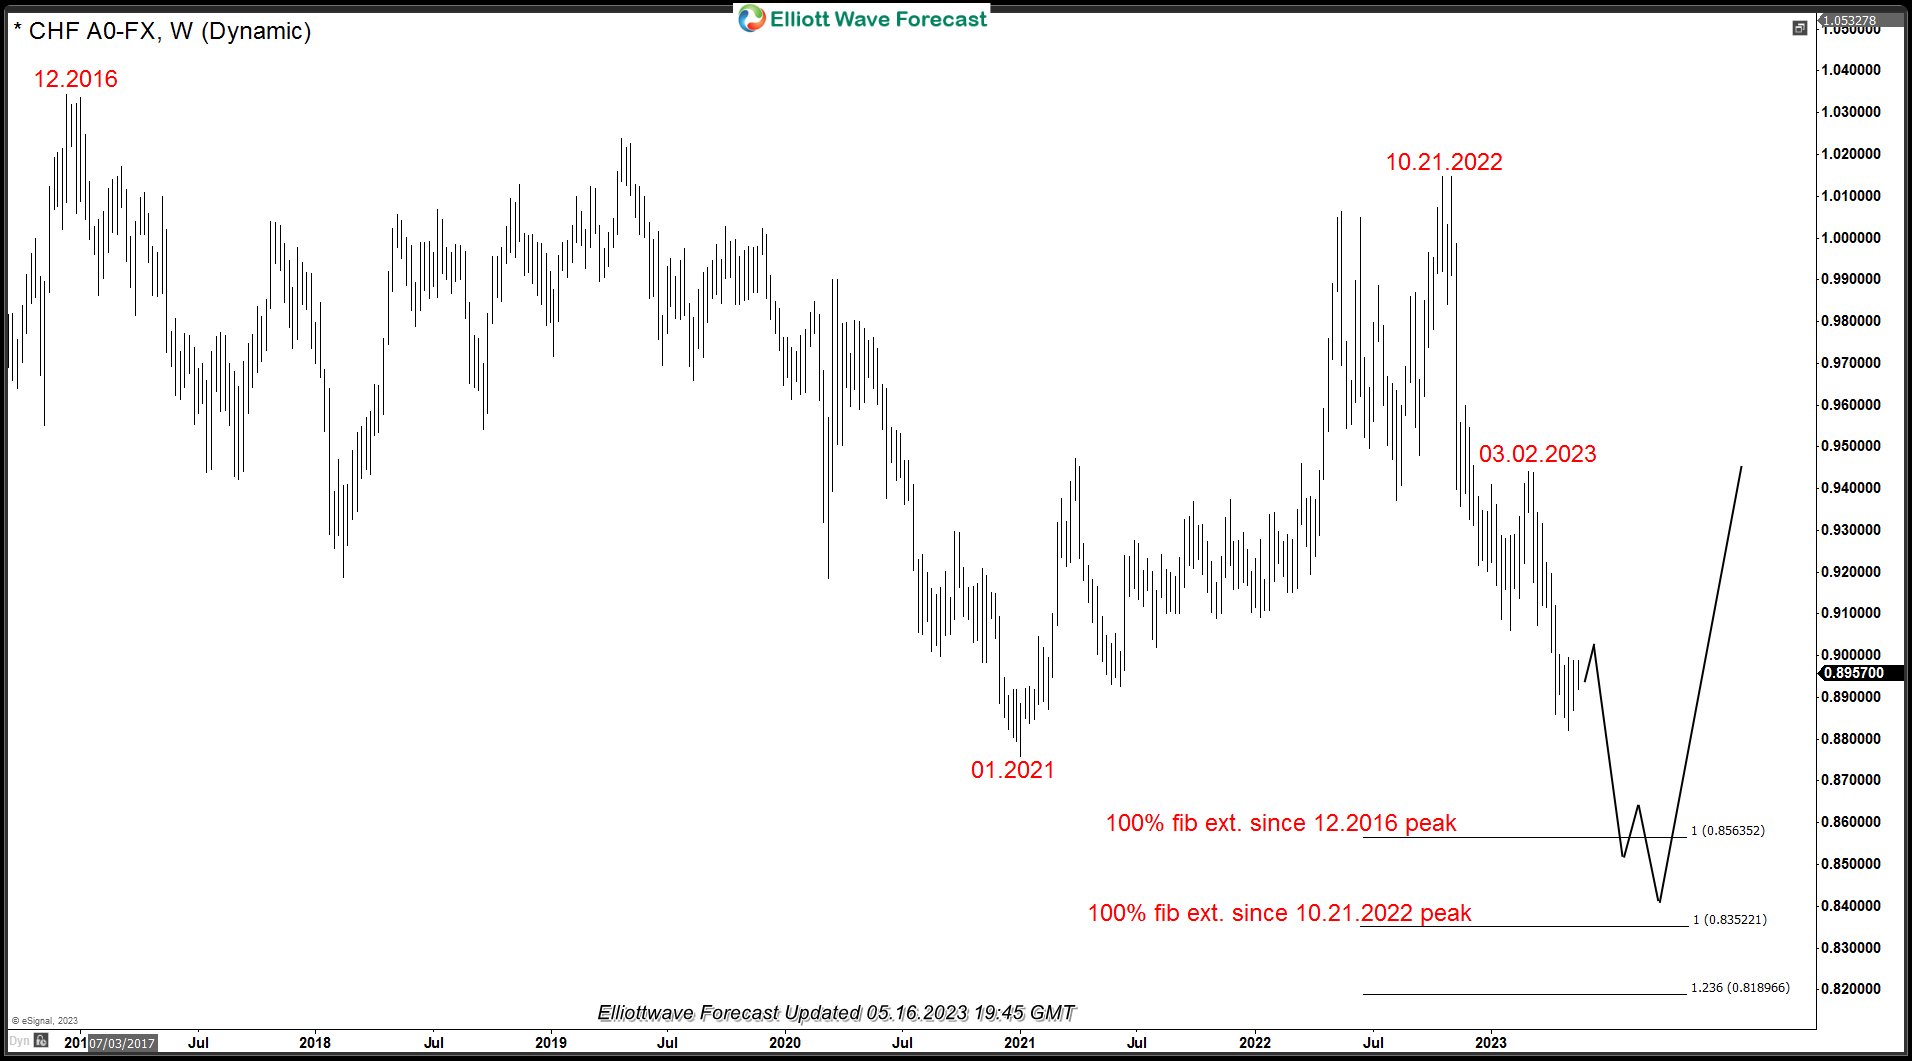
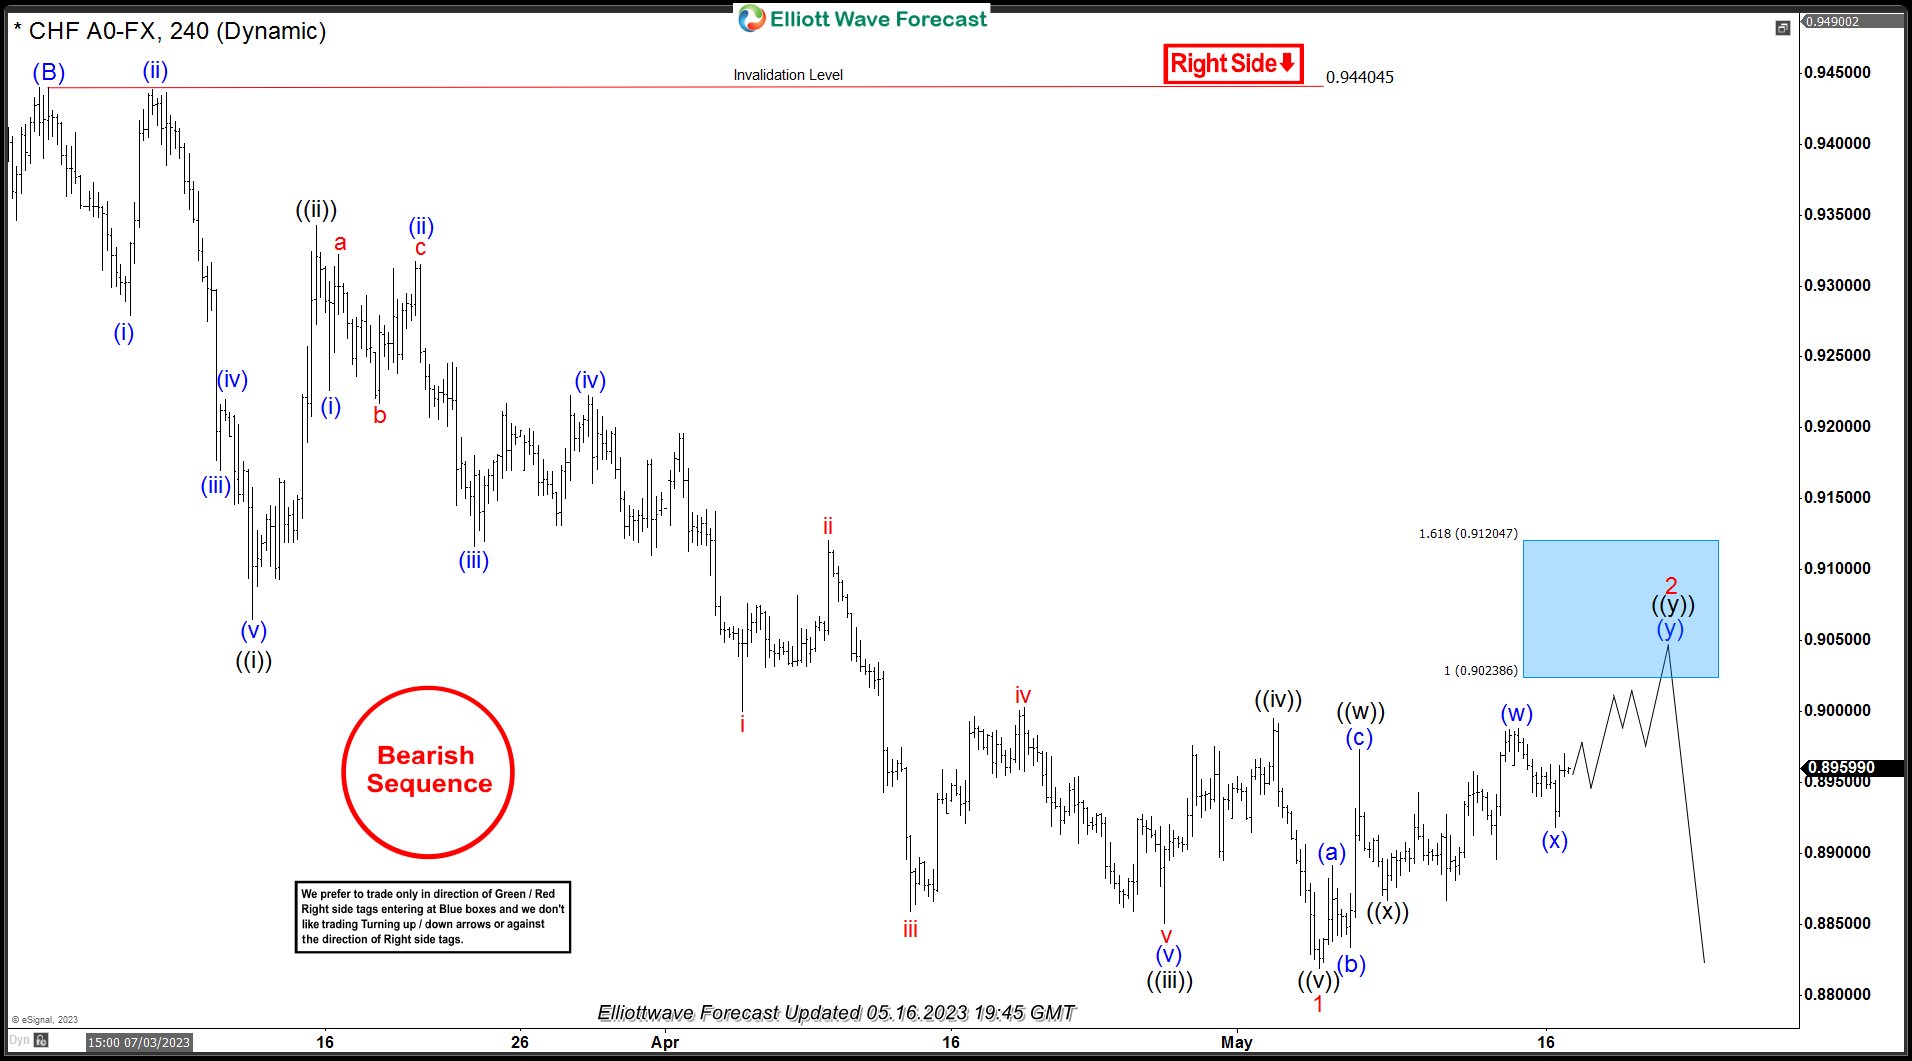
USDCHF has seen a strong decline since October 2022 peak with shallow bounces in-between. In today’s blog, we will take a look at the Elliott wave structure of the decline from October 21, 2022 peak, market sequence and next extreme areas which should be potential entry areas for both sellers and buyers. We will also present a details Elliott wave count of the decline from 03.02.2023 peak and also look at the structure of the corrective bounce since 05.04.2023 low.
USDCHF Bearish Elliott Wave Sequence and Double Extreme Area
Chart above shows USDCHF forex pair showing an incomplete bearish sequence down from 10.21.2022 peak with 03.02.2023 being the connector. So we expect the bounces to fail below 03.02.2023 peak for continuation lower. 100% Fibonacci extension from 10.21.2022 peak comes at 0.83422 which is below January 2021 low which will create an incomplete bearish sequence down from December 2016 peak with 100% Fibonacci extension coming at 0.8563. So while below 03.02.2023 peak, expect the pair to continue lower toward a double extreme area from December 2016 peak and from October 2022 peak and it should act as a power reversal area. This area should produce a reaction higher in USDCHF and US Dollar in general for a minimum of 3 waves and should be a very good area for buyers once reached.
USDCHF 4 Hour Elliott Wave Analysis and Blue Box Area
Chart above shows USDCHF cycle from 03.02.2023 ended as an impulse and pair is now bouncing to correct the decline from 03.02.2023 peak at 0.94404. Pair is showing 5 swings up from the low and we expect another swing higher to complete double there Elliott wave structure. 0.90238 - 0.92104 is the ideal area to complete 7 swings and this is where we expect sellers to appear to resume the decline toward the double extreme area shown on the weekly chart above or produce a reaction lower in three waves at least to allow sellers to get into a risk free position.

