Hello Traders, today we are going to have a look on how we were able to forecast the reaction lower in USDCHF from equal legs area. The pair was trading within cycle from 02.02.2023 similarly to the low of the USDX. It had ended first leg higher in A alongside a clear connector wave B. In this situation we could calculate where our equal legs area will be at.
Here at Elliott Wave Forecast we have developed a system in which allows us to project extreme areas of the market in which we can expect at minimum a 3 waves reaction off the area. This allows us to enter the market with a defined entry level and Stop Loss. Given the situation in USDCHF was within wave C of (B) higher in a 5 waves move.
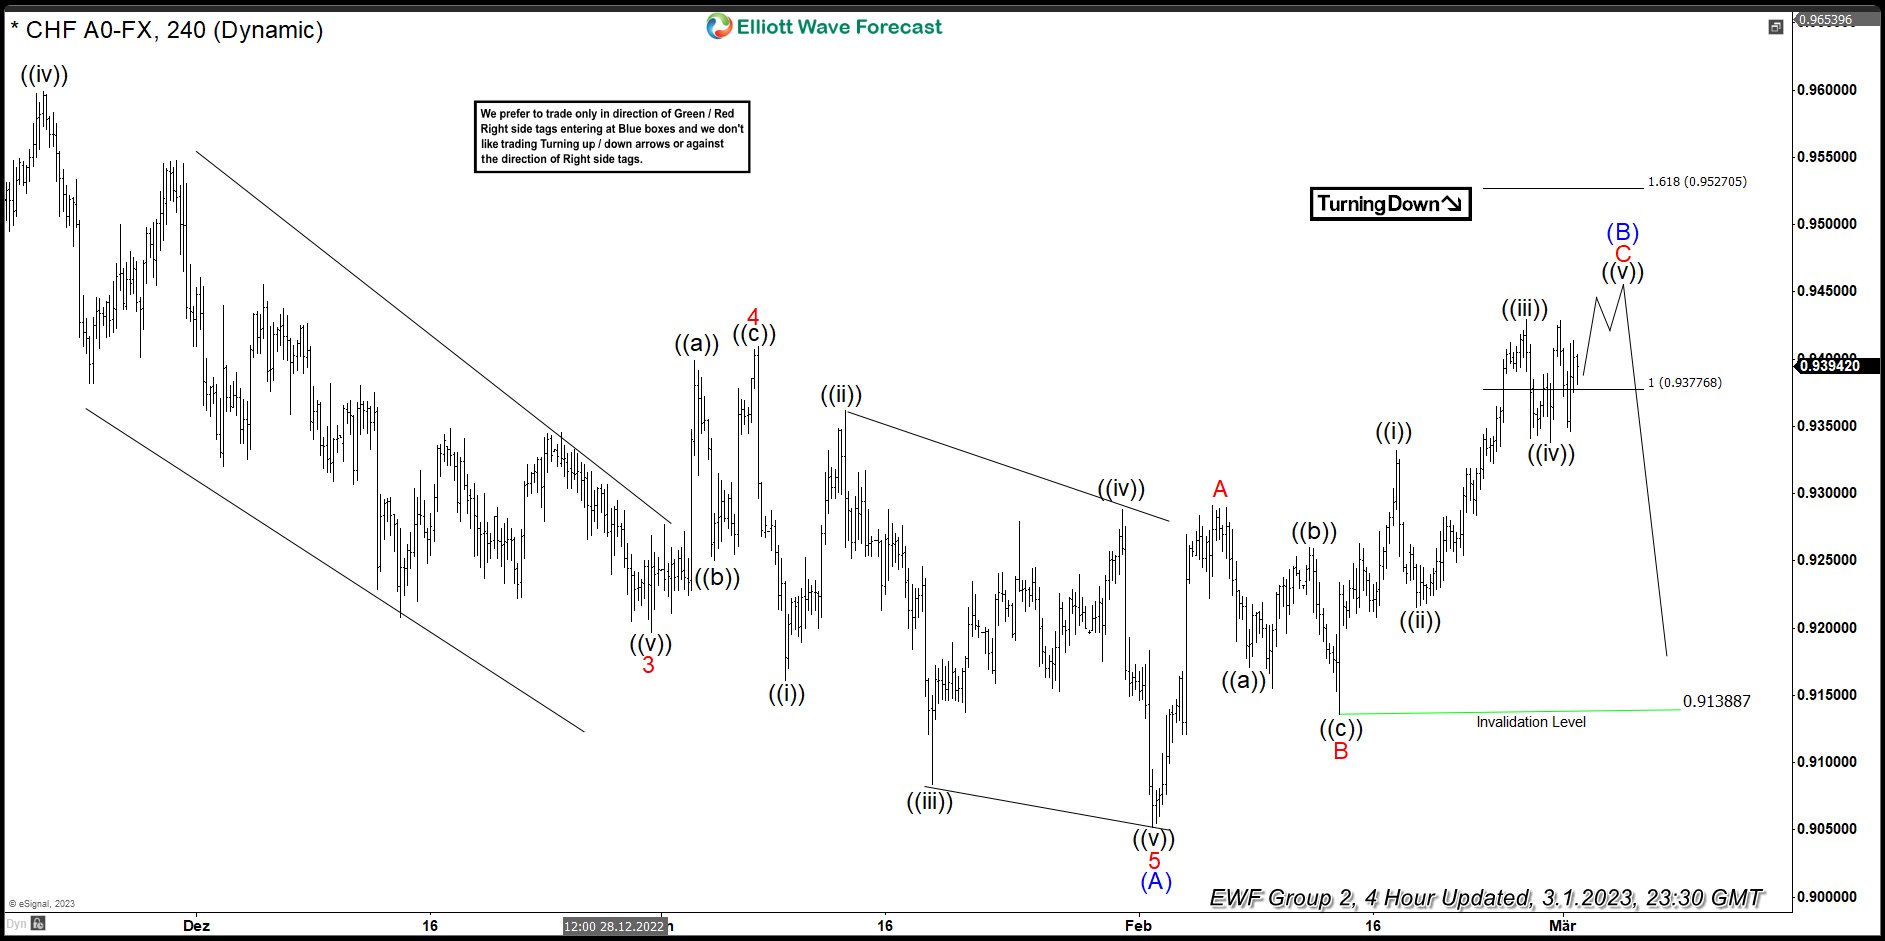
Let’s have a look on how we saw it during 03.01.2023 4 hour update.
USDCHF 4 Hour update 03.01.2023
 As we can see the pair was trading higher into wave ((v)) of C of (B) within the equal legs area of 0.93777 - 0.95270. This indicated that soon when wave ((v)) ends we should see the reaction lower from the area. Ideally wave (C) lower should get started.
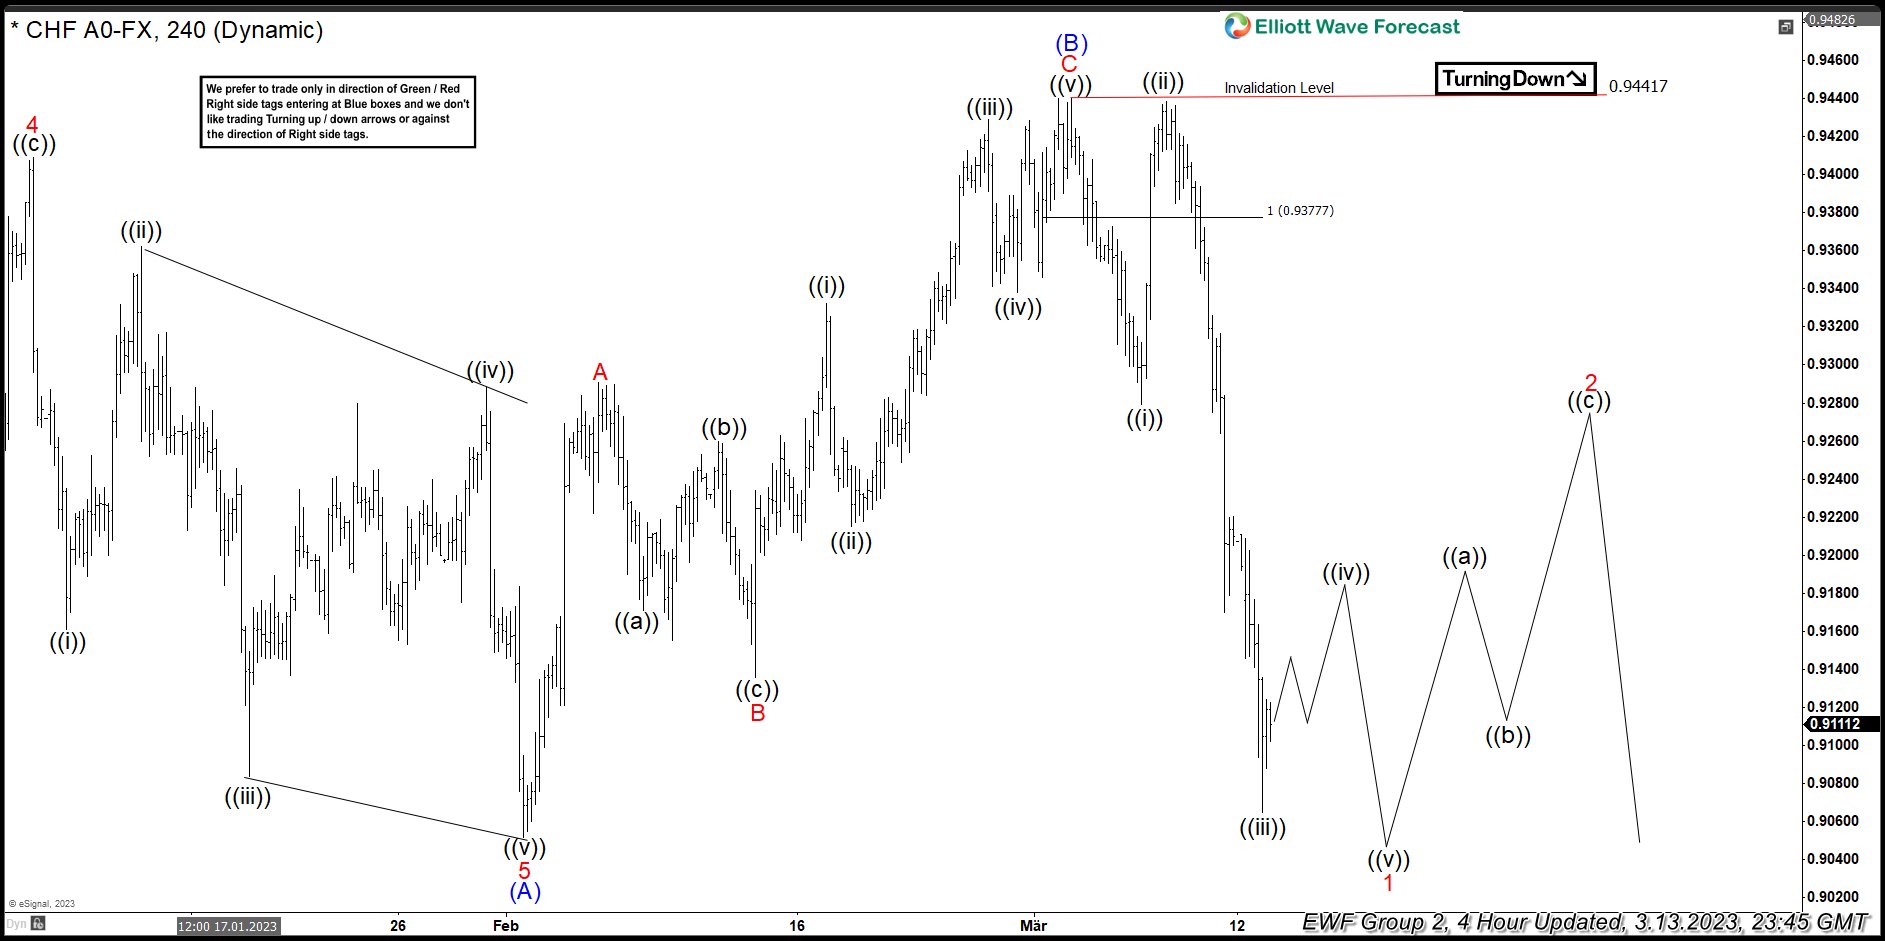
Now let’s see what happened next looking at USDCHF 4 hour chart from today’s update of 03.13.2023
USDCHF 4 Hour update 03.13.2023

As we can see it has perfectly reacted lower and currently bouncing within wave ((iv)) favoring one more low in ((v)) to end wave 1 in red. From there we could expect wave 2 bounce and then fail for further downside in wave 3 of (C). USDCHF belongS to our Group 2 instruments amongst other instruments such as the CHFJPY, NZDJPY, Nasdaq Futures, ES Futures, NIKKEI, cryptos like Bitcoin, Ethereum and others alongside some commodities like Natural Gas and others.
Source: https://elliottwave-forecast.com/forex/usdchf-reaction-lower-from-equal-legs-area/