Hello fellow traders. USDX is another instrument that we have been trading lately . In this technical blog we’re going to take a quick look at the Elliott Wave charts of USDX, published in members area of the website. As our members know, USDX is showing bullish impulsive sequences in the cycle from the February 2018 low calling for further rally. Consequently, we advised members to avoid selling USDX and keep on buying the dips in the sequences of 3,7,or 11 swings whenever get chance. In further text we’re going to explain Elliott Wave Forecast and Trading strategy.
USDX 1 Hour Elliott Wave Analysis 3.20.2020
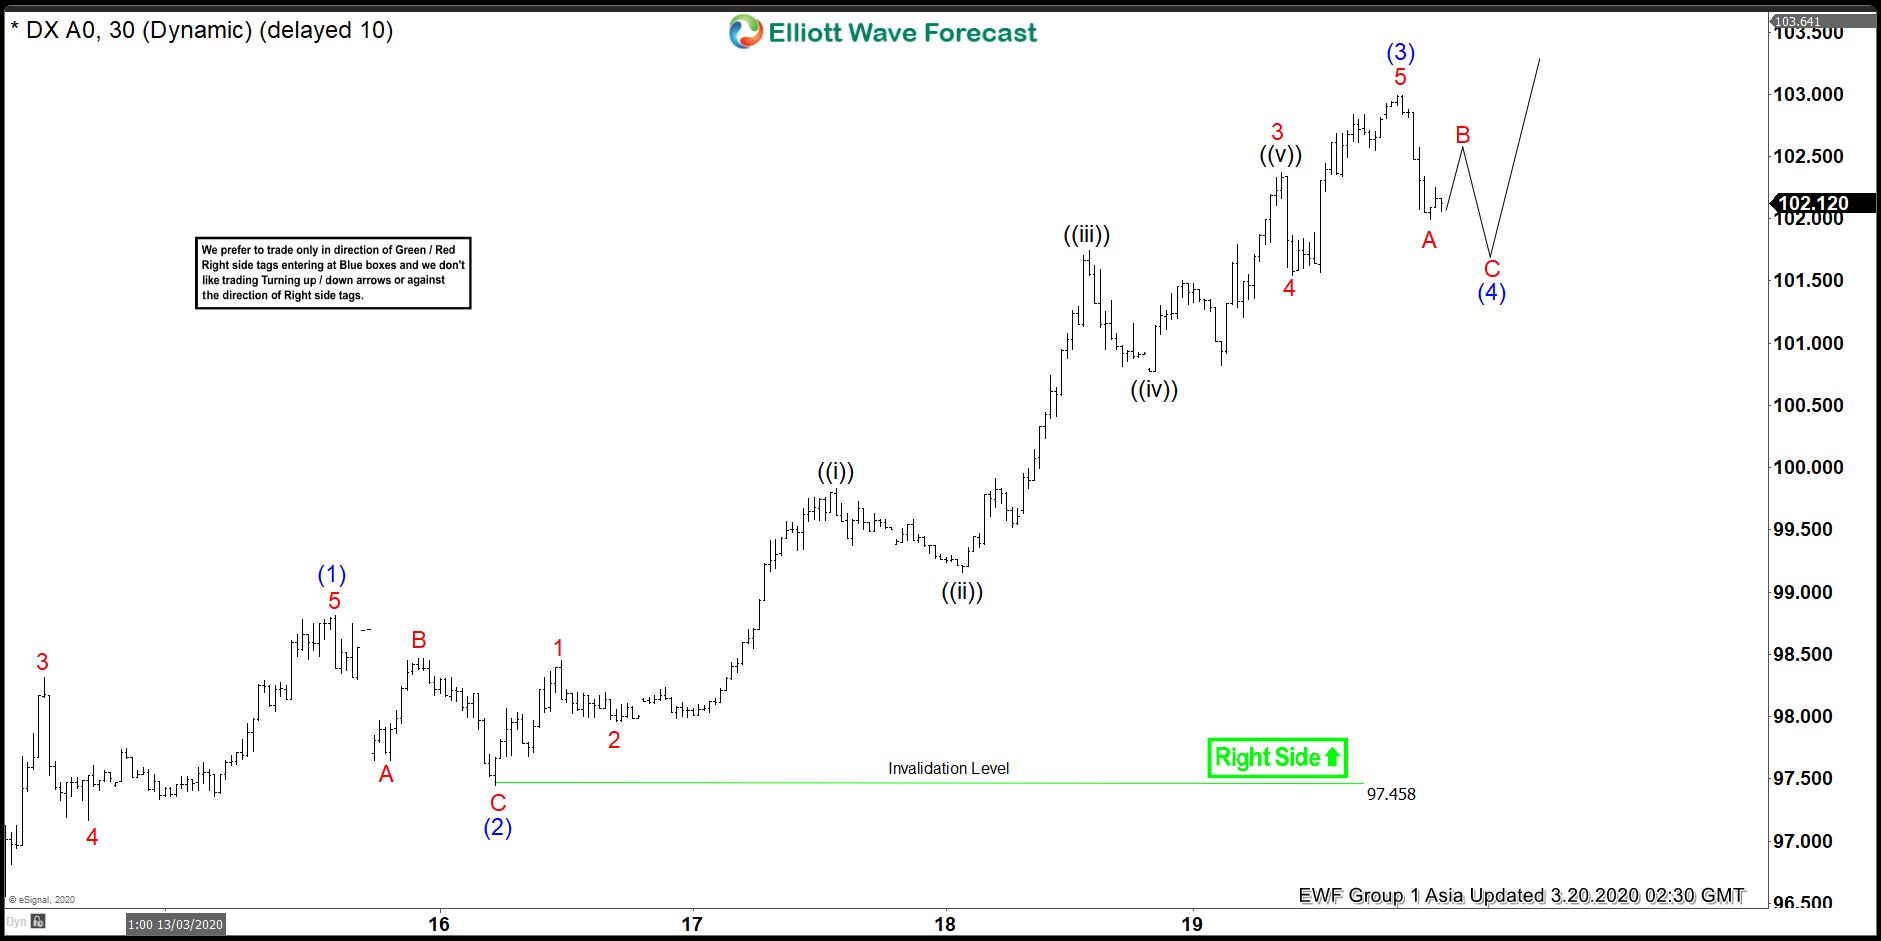
Currently we’re doing wave (4) blue pull back against the 97.48 low. Pull back can be unfolding as Elliott Wave Zig Zag Pattern, when we could have ended first leg A red of (4) blue. After B red bounce completes, we expect another leg down to complete proposed pull back.We don’t recommend selling and favor the long side. However we need to wait for clear 3 waves down from the peak before we could measure equal legs-buy zone.
You can learn more about Elliott Wave Zig Zag Patterns at our Free Elliott Wave Educational Web Page.
USDX 1 Hour Elliott Wave Analysis 3.20.2020
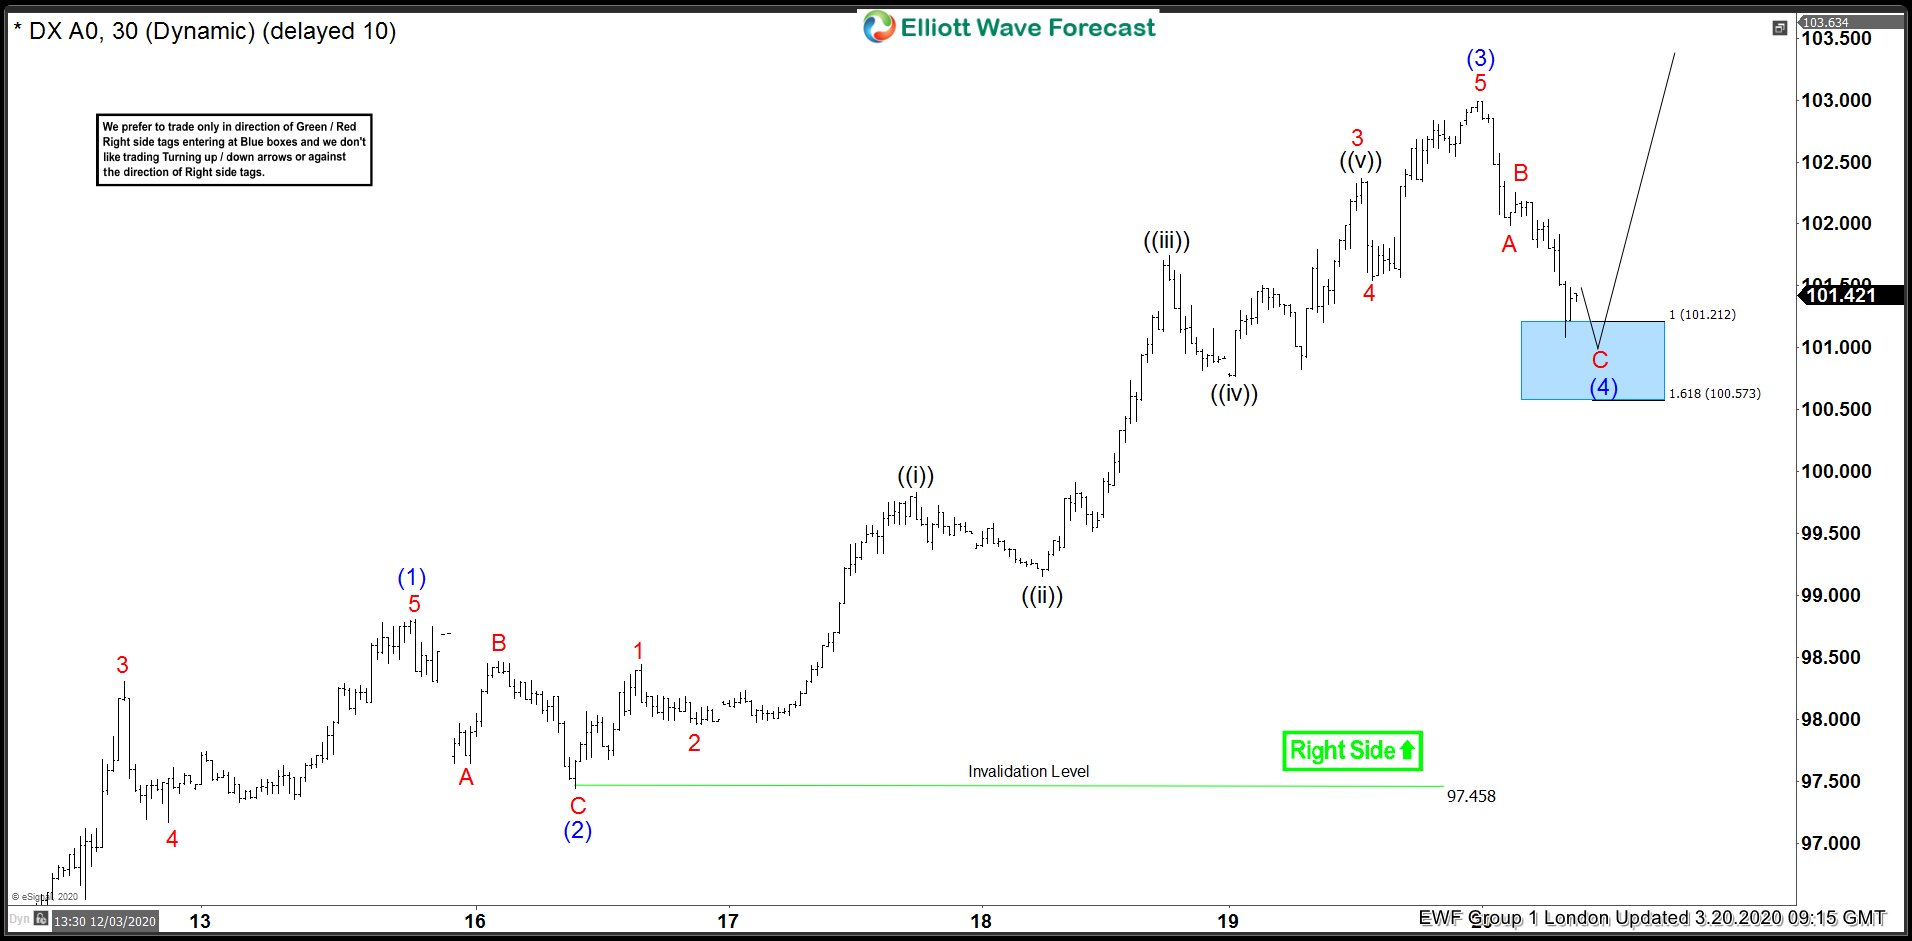
B red ended as a shallow recovery and we got another leg down C red as expected. USDX has already reached potential reversal area- buying zone. At the marked Blue Box area : 101.212-100.57 area we expect buyers to appear for proposed rally or 3 waves bounce at least. We don’t recommend selling it and favor the long side. As the main trend is bullish, we expected to get a 3 waves bounce from the Blue Box at least. As soon as the price reaches 50 Fibs against the B red high, we should make Long Positions risk free.
USDX 1 Hour Elliott Wave Analysis 3.21.2020
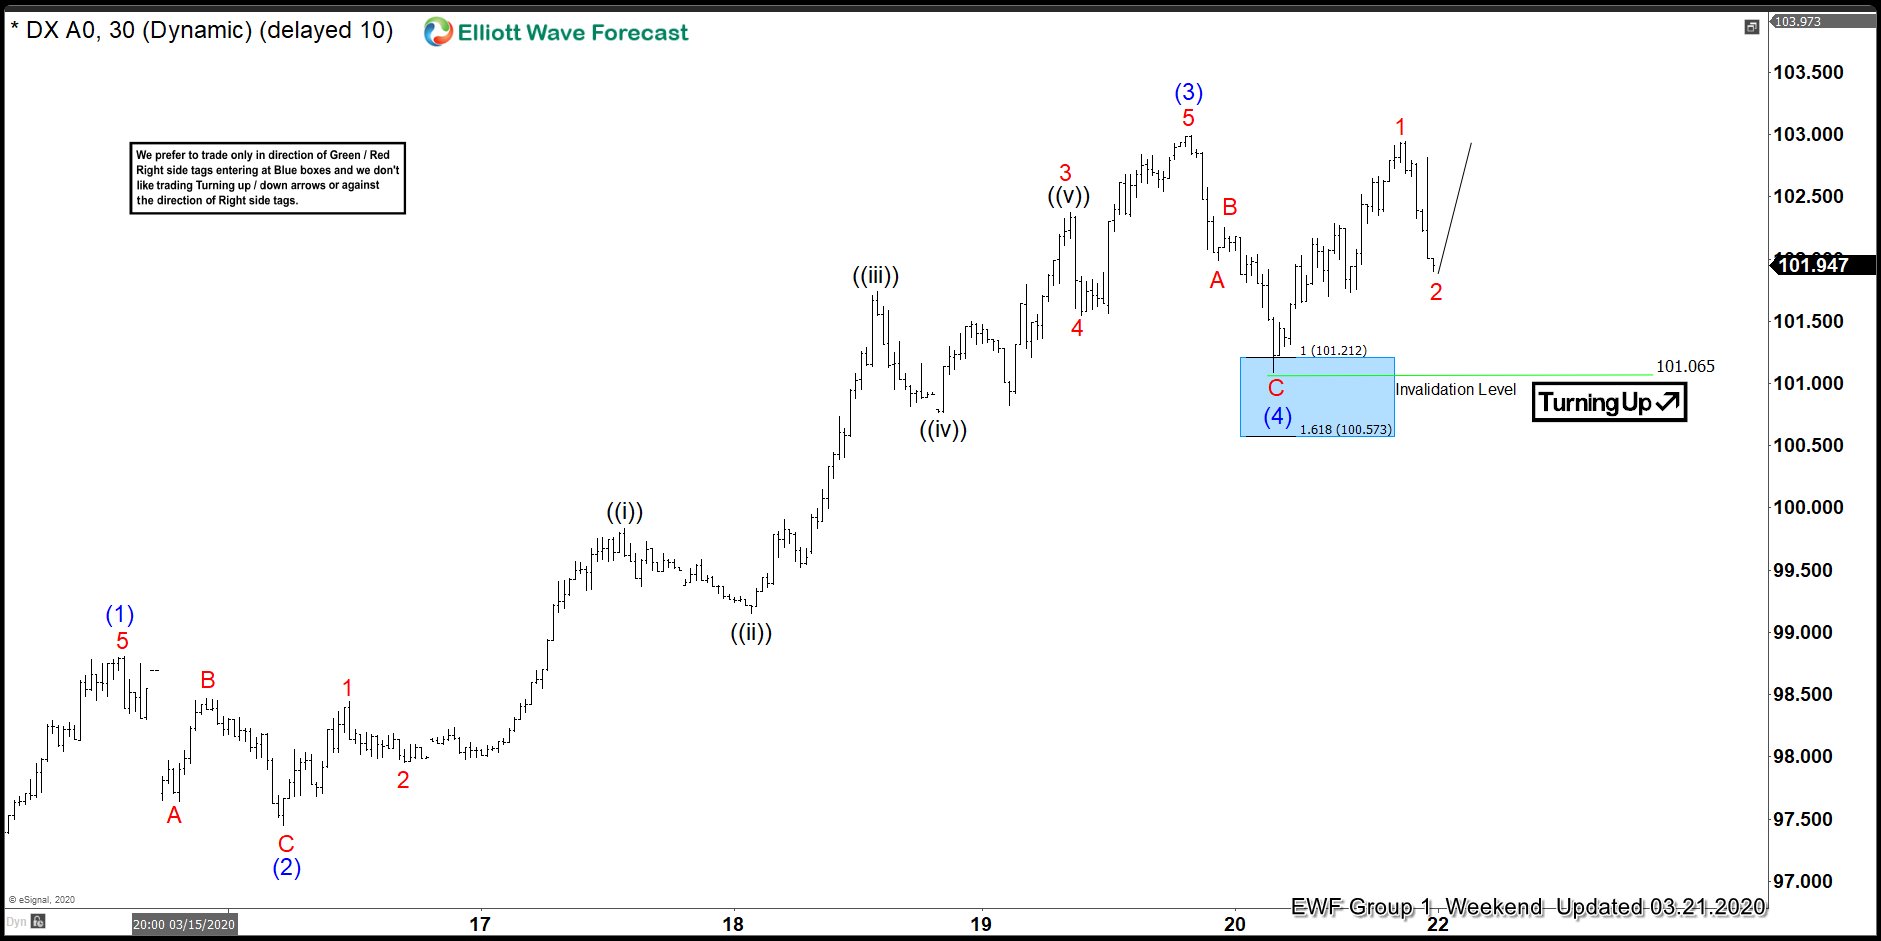
USDX found buyers at 101.212-100.57 , the Blue Box area. We got nice reaction from there so far. At this stage we are calling wave (4) blue pull back completed at 101.06low. However we would like to see further extension higher and break above 03/20 high to confirm next leg up is in progress. Otherwise break below current short term low :101.065 would open possibility for a deeper correction. Anyway, all longs from the blue box should be risk free at this stage.
Keep in mind that market is dynamic and presented view could have changed in the mean time. Best instruments to trade are those having incomplete bullish or bearish swings sequences. We put them in Sequence Report and best among them are shown in the Live Trading Room. You can check most recent charts in the membership area of the site.
Elliott Wave Forecast