Vale is a Brazilian multinational mining corporation and also is the largest producer of iron ore and nickel in the world.
In 2016, many commodities saw significant moves to the upside with the rise of Oil and Gold prices. The move helped metal & mining sector to recover after 5 years of decline and many stocks started a new cycle higher.
Vale was one of the outperforming stocks during that period rallying higher for 2 years from $2 to $16. However, on October 2018, the stock hit the 10 years descending trend-line from 2008 and ended the cycle from 2016 low.
Despite failing to break above the trend-line, Vale ended the bearish cycle from 2008 as the pivot around 2011 peak has gave up in our system. We use our proprietary pivot system to tell us when a cycle has ended and when an instrument need to switch to a different degree. Therefor, Vale will be looking to either start a new bullish cycle to the upside or at least correct in a big 3 waves bounce toward the 50% - 61.8% area ($23 - $28).
Vale Weekly Chart 3.12.2019

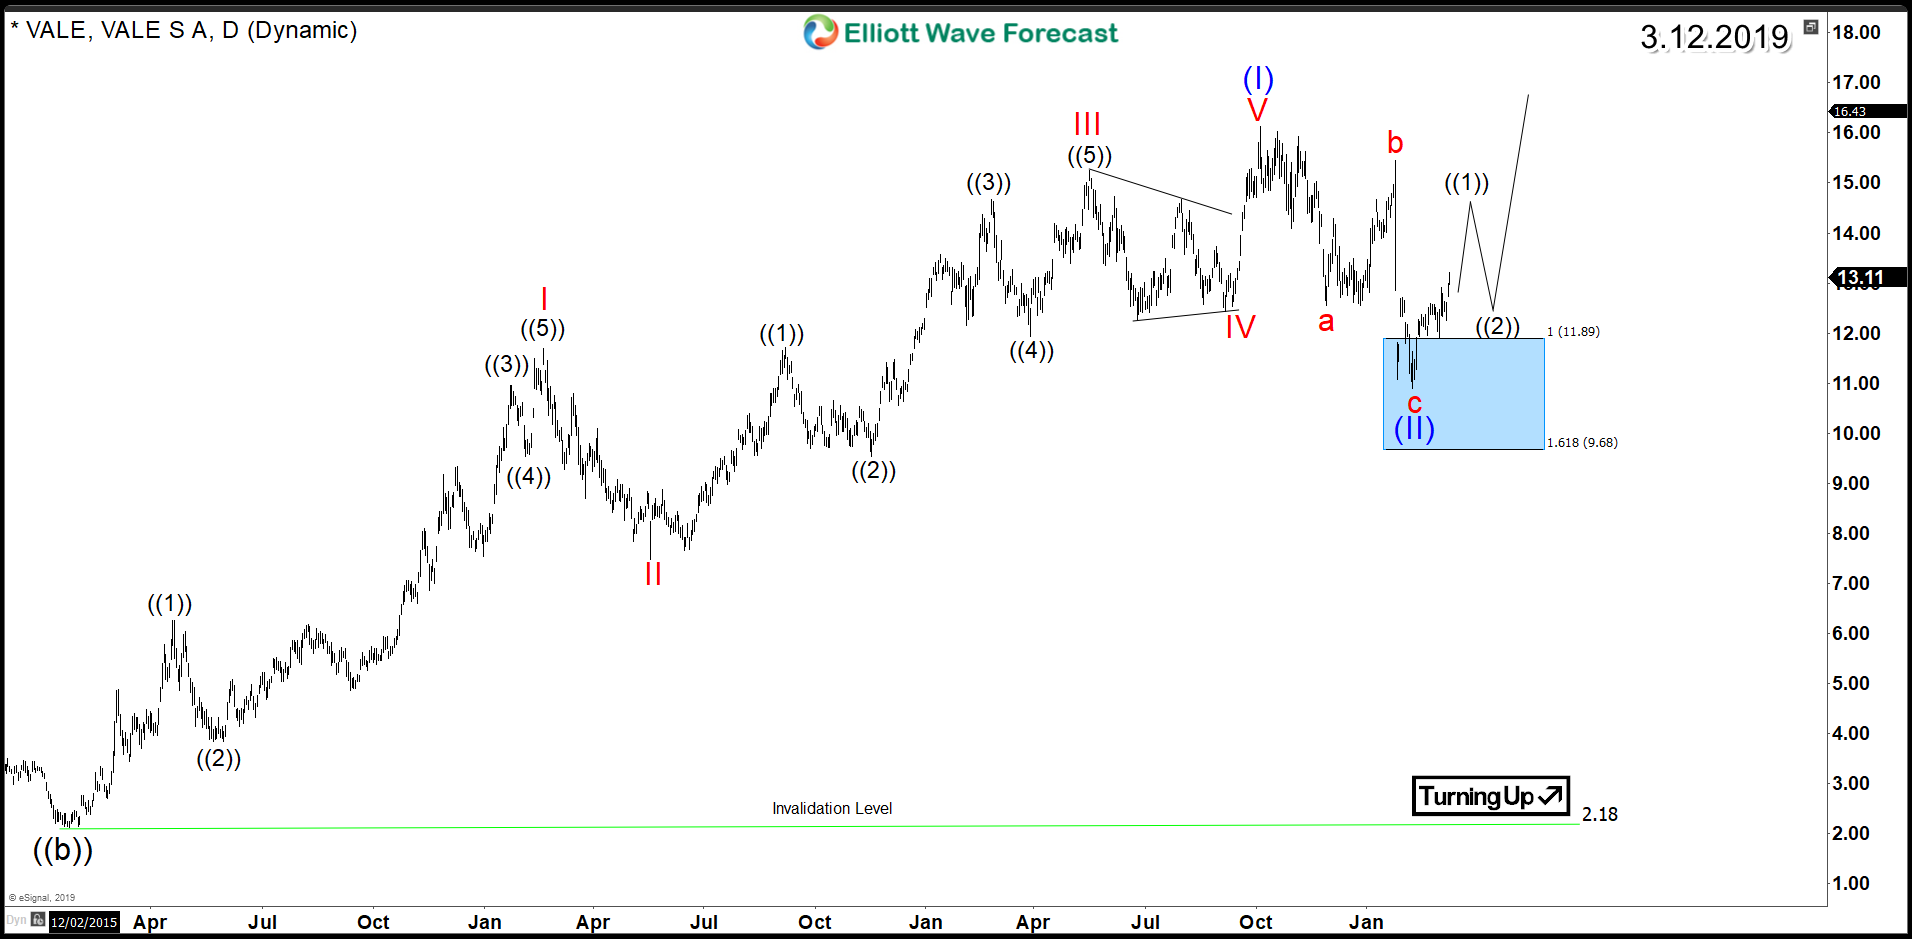
Based on the Elliott Wave Theory, Vale rally from 2016 low was an impulsive 5 waves move which was followed by a 3 waves pullback into blue box $11.89 - $9.68 that represents a high-frequency area where the markets are likely to end cycles and make a turn.
Up from there, the stock started bouncing higher again aiming for a break above 2018 peak to start the next cycle to the upside. However, until it breaks that peak, Vale could still make a double correction lower toward $9.13 - $7.47 area before buyers show up again for another bounce.
Vale Daily Chart 3.12.2019
Recap
Vale is looking for a larger recovery after ending a 10 years bearish cycle and a break above the descending trend-line will trigger the move to the upside. Consequently, investors should keep a close eye on the stock as a break higher would provide a tradable bullish sequence.