Ever wondered whether knowledge of Economics is actually necessary to be a profitable Trader? As someone with a Masters in Economics and as a former Central Bank Economist, I can state categorically that this is not true!
This can be quite surprising given the nature of the market we trade- exchange rates. However, after 10 yesrs of trading, it has become clear to me that all you need is a knowledge of how Candlestick Patterns work on the Larger Time Frames. Here is a brief summary of my strategy that explains and justifies my approach to trading.
THE TRADING STRATEGY
Overview
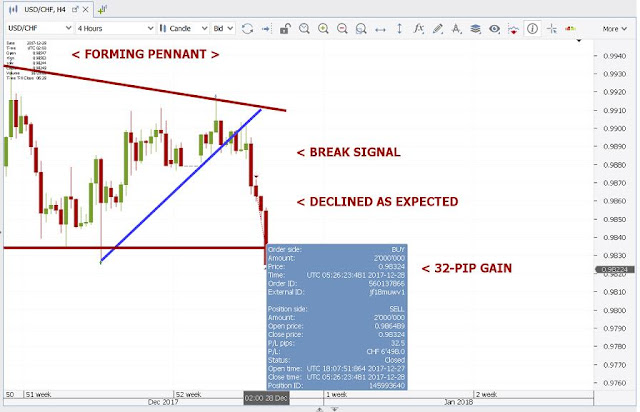
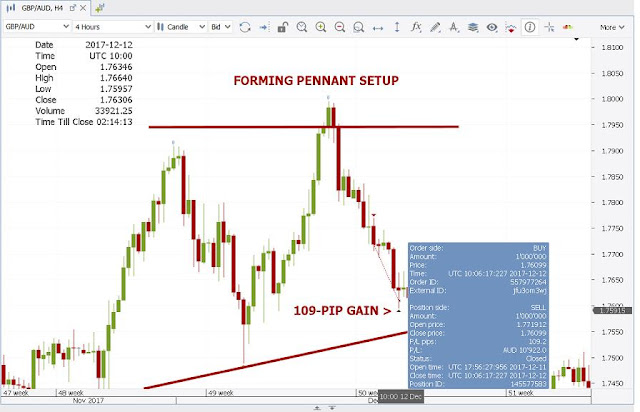
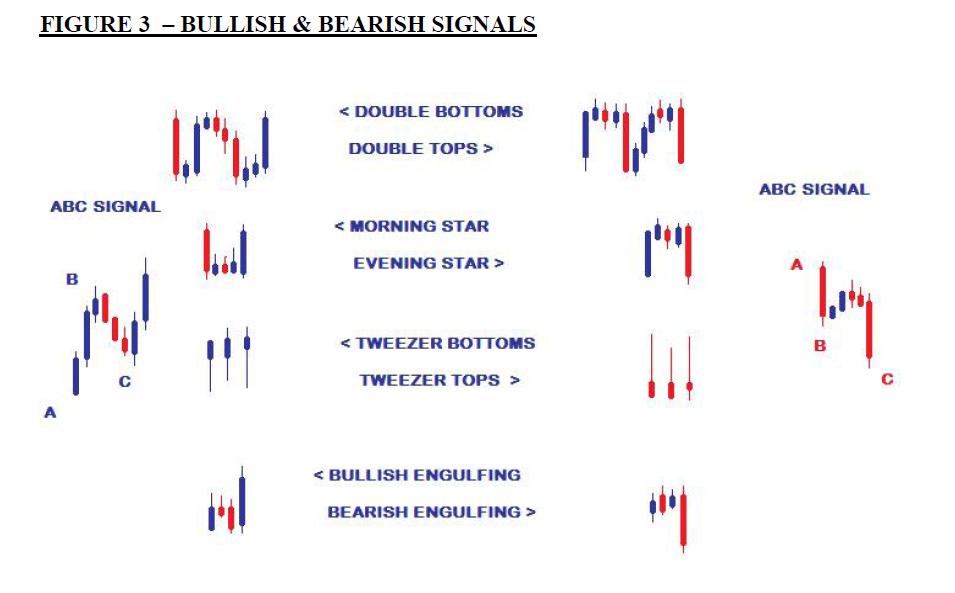
The strategy targets gains of 50-70 Pips over a 24 Hour Period using the accurate Candlestick Patterns, Trend Lines and Consolidation Setups of the Daily and 4 Hour Charts. After experimenting with various Statistical Indicators across all time frames for several years, I finally discovered that there were certain combinations of Japanese Candlestick Patterns that offered more reliable Entry Signals, especially when combined with the correct way of drawing Trend Lines and the “Best-Fit” Method of identifying Consolidation Setups with Support and Resistance Lines.
Higher vs Lower Time Frames
Higher Time Frames in general were found to be more reliable with fewer False Signals and “Whiplashes” compared to the 1 Hour and lower charts. With this in mind, the Daily and 4 Hour Charts were then chosen as the time frames to use because they offer the best combination of the following factors that I have been looking for in a profitable strategy
-
Reliable Signals & Stable Patterns
-
Strong & Reliable Stop Loss Areas
-
Manageable Stop Loss sizes (30-45 Pips)
-
Setups with a High Probability of Success
-Trading Targets with Small Holding Periods
Economic & Financial News
As a former Central Bank Economist with a Masters in Economics, I can state categorically that a knowledge of Economics or Financial Markets is NOT necessary to successfully trade the Forex Market.
Yes it is true that many strategies out there successfully use Economic Data to predict market direction and that knowledge of various Economic Variables is crucial to the conduct of Monetary and Exchange Rate Policies. However, at the Retail Trader level that targets short moves within 24 hours, finding accurate Candlestick Signals was found to be more reliable than using short -term economic data that is too volatile to be used in a meaningful way.
In addition, what you will notice is that whenever there is a major news release during the day, the Candlestick Signal formed on the Larger Charts will eventually reflect the overall reaction by the market to the news. This means that you can simply wait for this Candle to close to indicate where the market is headed and then trade accordingly - without having to play the guessing game with these releases on the smaller charts.
The Pip Targets Per Trade
The strategy builds on the ability to accurately forecast the Weekly Range Direction of Currency Pairs each week. This accuracy provided the foundation of my previous strategy that captured 100-200 Pips per trade over the last few years and which led to an average return of 40% each year. While this was a good conservative performance that was a safe approach to long-term profitability in a dangerous market with a high failure rate, the recent narrowing of exchange rate movements has made targeting large trends and breakouts a very risky activity.
This therefore led to the search for a more aggressive approach that takes advantage of these smaller Pip Ranges. So instead of going after large gains over 5 to 7 days, shorter targets of between 50 to 70 Pips are now the focus to best take advantage of the narrow trading ranges.
Market Direction & Trade Entry
Both the Daily and 4 Hour Charts are used to identify market direction over a 7 day period. Once identified, the 4 Hour Chart is then used to trade in this direction for the targeted Pip Gain.
Stop Loss Placement
To protect the trade over the 24 Hour Holding Period against temporary pull backs, the following areas on the 4 Hour Chart are used for our Stop Losses
These are the only areas deemed strong enough to protect trades until the trade targets are hit. If these are not present on the 4H, the trade will be deemed too risky and will be foregone to avoid losses.
Market Setups Traded
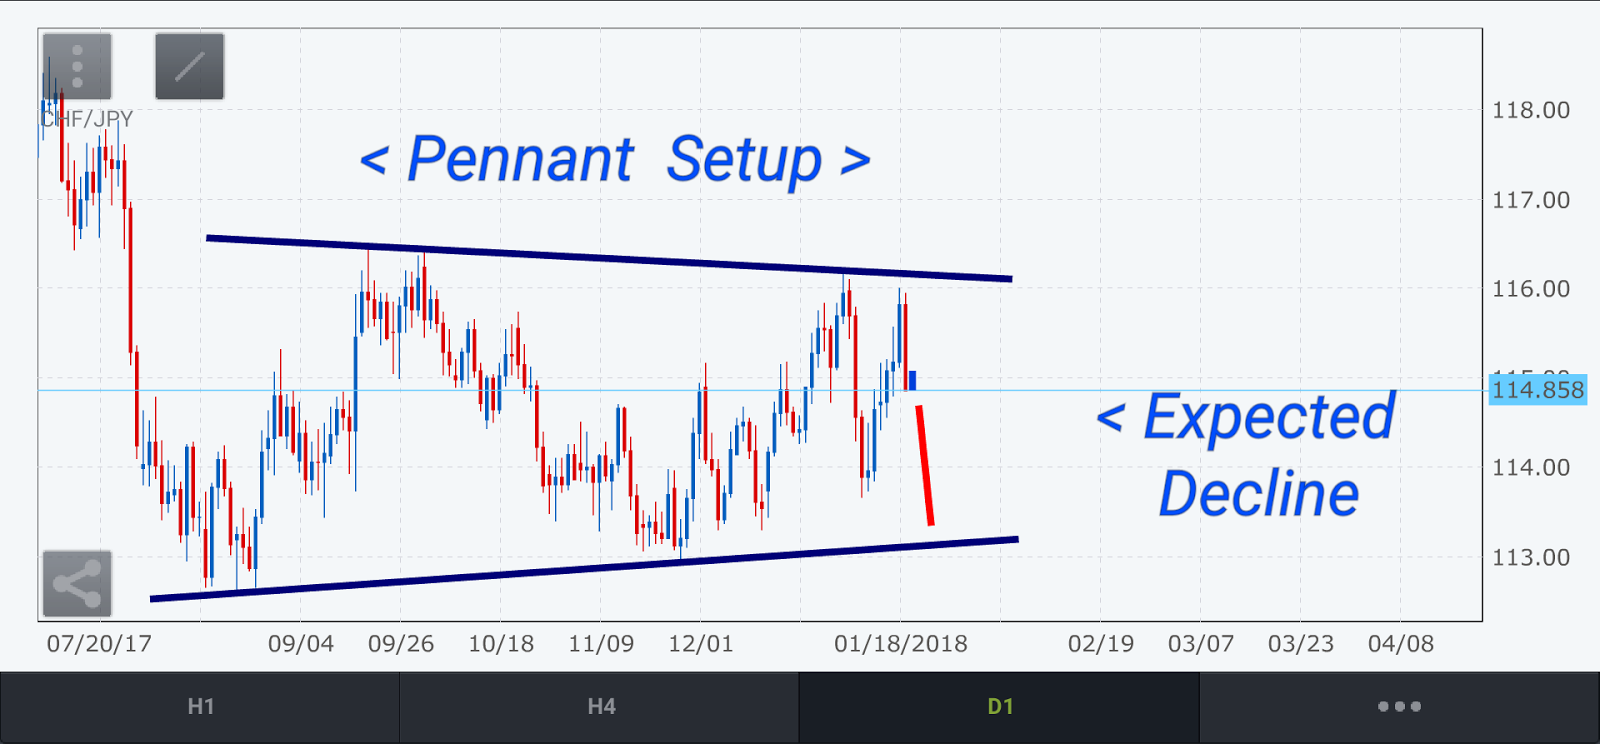
Due to the narrow range of currency movements that we see each month, more Consolidation Setups have been formed across Currency Pairs with very few of them providing stable and reliable breakout opportunities as they had in the past. This is why my trading is done strictly within the Consolidation Setups formed on the Daily and 4 Hour Charts.
Consolidations that have a minimum distance of 150 Pips and a maximum of 400 Pips between Support and Resistance are the ones that are traded. These allow me to comfortably capture my trading targets within these wide ranges, while not having to wait too long for these gains to be realized.
Trading Frequency
On average, there are 1 to 2 of these High Probability Setups that arise each week. This means that with an average time of 3 to 7 days between trades, I do not have to be tied to my computer screen everyday and will have time to recover from both the euphoria of a good trade as well as the disappointment of a loss.
Risk Capital Per Trade
The Risk Per Trade that I use is 2% on average, targeting an average Monthly Return of 14%. This is in line with the Monthly Return that I now want to capture over the long-term.
The Holding Period & Trade Exit Rules
What I discovered was that in 90% of the scenarios in which the High Probability Setups offered stable 50-70 Pip moves, they didnt need more than 24 Hours on average to hit these targets. Any longer than this usually meant that the market was beginning to slow down and that a reversal was imminent. This is why as one of the rules of my strategies, any trade that has not hit its target within this fixed period will always be closed. This is done to avoid the bad habit of becoming greedy or needy and more importantly to avoid severe trade losses from sharp market reversals.(ex. The Sharp CHF gains from the SNB shocker)
What do you think?
Duane
DRFXTRADING


