For the record.
What time zone are you in.
For the record.
What time zone are you in.
Caribbean… Eastern Standard
Hey guys
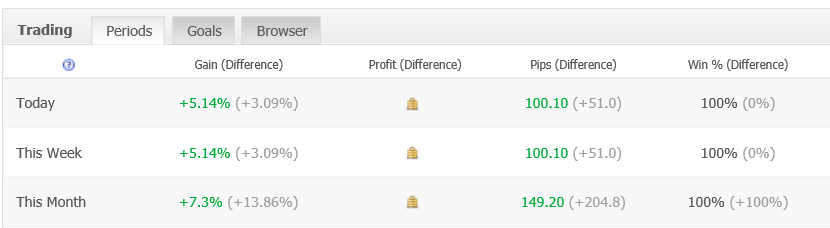
So far so good. Below is the Weekly and Monthly Summary
Lets see what this weeks brings.
Duane
DRFXTRADING
THE TRADE SHEET I USE TO REMAIN DISCIPLINED
After determining that a Trade has the potential to be profitable, I then write down the relevant information in a table when I am about to trade on my Live Account. This includes key rules I follow to remain disciplined and unemotional after the trade has been implemented.
And this was the result of this discipline for that trade last week…100 Pips in 5 Hours as Safe Haven Activity over ran the market…

It is very easy to give in to the temptation to watch our trades as they head towards our targets, but this is a disaster waiting to happen and must be avoided at all cost.
The reason to not do this or watch Financial news is that something that we may see or hear that indicates movement against our trade could lead us to become irrationally fearful and hesistant about our decisions. However, with all successful trades, there will always be temporary market reversals and investor opinions against our trade that eventually fade into insignificance when the market finally begins to move our way and hit our target.
So lets take this trade as an example. 4 Hour Chart had given us this Signal indicating it was time to short.
However if I had made the mistake of looking at a lower time frame and saw the temporary movement against my trade…
…chances are I would have been tempted to adjust, reduce my exposure or close my position all together in the face of this pullback. But if I did so, it would have meant being disloyal to my own instincts and analysis and would have foregone this profit as the market eventually U turned to resume the downtrend…
PAIN OF MISSED OPPORTUNITIES FROM SELF DOUBT IS MUCH WORSE THAN A LOSS OR MISTAKE
So it is with most things in life. Once you are sure about the signals being provided by the market and you are sure that it conforms to your tested Strategy, you must trust yourself and let the market do the rest.
The market hardly ever hits our targets in a straight line or within seconds of opening a position. Like all markets, there will always be temporary pulllbacks to reflect the natural dynamic of asset prices. But as long as our Strategies and decisions are in sync with where the market will eventually go, most of your trades will be correct.
Happy Trading
Duane
DRFXTRADING
Hello Duane,
I’m glad to hear you find our feed more accurate for your technical analysis. I’m not sure if you know but in the FXCM Trading Station 2, you can see your risk return values in the orders window by selecting “Advanced”.
Jason
Hey Jason,
Yes I know about this option, but its these values expressed in Percentages that I prefer to see.
Helps make sure I stay within my boundaries better than seeing the numbers alone.
Regards
Duane
ACCURATE WARNING ON USD CAD AND GBP USD WEAK SIGNALS HELPS AVOID SERIOUS TRADING LOSSES
Within the last 24 Hours, I had been looking at the possibility of Shorting the USD CAD for a projected gain of 50 Pips following the Bearish Candlestick Signal that was formed on its Daily Time Frame. This was going to also be within the context of a Pennant Consolidation Setup that appeared to be forming that would see the pair declining over the next few days.
USD CAD DAILY CHART POSSIBLE PENNANT
However, instead of providing the required Bearish Signal on the 4 Hour to confirm this move (part of my Trading Strategy), a weak signal was given that was not enough to justify the trade.
USD CAD 4 HOUR CHART SETUP AND WEAK SIGNAL
With weaker than expected Candlestick Signals like this, it increases the possibility of a reversal to either start a Trend Change or form a Consolidation as highlighted above.
This was then sent to a fellow trader as a warning about the potential for a reversal that meant abandoning the potential trade…
SCREENSHOT OF EMAIL SENT
(This is the Trade Setup I use to remind me to stay disciplined. FXCM Charts are used to identify market direction and signals. I use FxPro however to actually trade. FxPro sends me an email alert so Im not tempted to interfere with my trades. Here I assumed a Strong 4 Hour Candle that would close at the 1.2420 area.)
However, those traders who do not look at the 4 Hour for guidance or who dont pay attention to the difference between weak and strong signals would have been caught out by the reversal as predicted…
USD CAD BULL CANDLE REVERSAL
This would have led many wondering why this downtrend suddenly turned Bullish. Was it due to Stop Loss Hunting? A Major Market Moving Economic Data Release? Neither.
WEAK VERSUS STRONG 4 HOUR SIGNALS
What you will find is that Breakout Signals on the 4 Hour Chart - which controls the Lower Time Frames - that are too weak have an increased chance of leading to reversals. This is why it can appear as sudden and unexplained trend changes on the lower charts.
A similar situation can be seen here on the GBP USD that I was also looking at. Again, instead of providing the desired signal to continue the 4 Hour Uptrend, a weaker than expected signal was given which on the lower charts would have appeared as a fairly strong bullish movement…
GBP USD 4 HOUR CHART REQUIRED BULL CANDLE
However, as can be seen here, the market did what it normally does with weak signals - takes them out…
GBP USD 4 HOUR CHART REVERSAL
Another Trading Loss avoided.
SUMMARY
So in a nutshell, knowing the Technical Factors that actually control the Forex will be key to our Long-Term Trading Success in this Dangerous Financial
Market.
MAIN ASPECTS OF ACCURATE WARNING
Knowing How Counter Trend Lines behave during Trends is Crucial to Anticipating Reversals
Mastery of Candlestick Patterns on the Daily and 4 Hour Charts is key to Predicting Market Direction
Waiting for the 4 Hour to give us a Signal is sometimes needed to validate the Signals of the Daily Chart
Not Having to Rely on Economic Data to Trade and Accurately Predict the Forex.
Happy Trading.
Your Trading Guru.
Duane
DRFXTRADING
101 PIPS ON EURO CAD
This trade in the Dukascopy Contest took advantage of the Consolidation Breakout on its Daily Chart that started several days ago. ( Breakouts no longer done with my Live Account Strategy).
This used a Stop Loss of 200 Pips as you can see to ensure I stayed in the trade, and the original target was 200 Pips However , I began
to see evidence of overbought conditions based on the Candlestick Patterns on the Daily Chart so decided to exit.
Right now I am way down in the rankings…250th lol…because I hadnt been focusing on this contest. (focusing more on my Live Account and helping traders). But I may consider this as a challenge to see how far I can finish.
Couple notes about Demo Trading Contests vs Live Trading…
Can use larger Stop Losses compared to Live (maximum 80 Pips Live, average of 45 Pips most trades)
Can wait patiently for much longer with Demo than Live…this trade was open for 12 days!! (Maximum 24 Hours Live.)
Can look at trades in motion and make objective decisions. With Live…I dont and tell traders I help to not do so because with real money…easier to make bad decisions looking at trades.
Lets see what next dew days bring
Duane
DRFXTRADING
Hello Duane,
Thanks for posting the picture. Unfortunately, we do not have exactly what you are looking for but it is a good suggestion that I will pass to our developers.
Jason
CHANGE OF MONTHLY TARGETS
Hey Traders
I am changing my Monthly Return Targets from 30% to 14%. This is a more realistic target given the changes made to my Strategy and the need to avoid Low Probability and Risky Trade Setups that we come across everyday.
TRADING STRATEGY
MONTHLY TARGETS

This assumes an Average Risk of 3% Per Trade. So with a 7.3% Return for February from just 2 Trades …
only a handful of trades are actually needed to meet these monthly targets and achieve major gains in the Short Term and Long Term.
Duane
DRFXTRADING
55 PIPS ON USD CAD
This was a test trade done on my Demo instead of my Live Account to determine if it could be included as part of my Strategy.
The reason was that the Current Strategy focuses solely on Smaller Consolidations whereas this was a Large Setup. So there was some doubt as to whether the current rules of Pip Targets (50 to 70 Pips) and short Holding Periods (24 Hours) could be appplied/ captured before the market pullsback.
With the trade being successful and hitting the target within 24 Hours, these Larger Breakouts ( more risky/greater uncertainty) can be included from now on.
This was the Setup. The Daily Chart appeared to be forming a Large Pennant and had just given a Bullish Signal - supported by a Bull Crown Setup - to indicate the move towards where it was expected to form Resistance…
So the Pip Target of 55 Pips was set with the 4 Hour ABC Signal and Uptrend Line being used as strong Stop Loss Areas to protect the trade…
After executing the trade, the pair eventually made its way to the target…
So another test trade in the bag following the previous one on the NZD USD for 50 Pips…
…which tested and confirmed that smaller Daily Candle Signals can still be profitable, as long as they are supported by a Strong Trend and Stop Loss areas on the 4 Hour Chart…
Always best to test strategies on a Demo if they are a little bit different from your current Live Account Strategy.
With these 2 added into the mix, the current Rate of Return of 7.34% on my Live Account is very likely to hit and theb surpass the first target of 14% in the next few days.

Stay tuned.
Any body traded either of these pairs?
Duane
DRFXTRADING
TRADING GAIN OF 24 PIPS ON AUD CAD
LIVE FXPRO ACCOUNT 4 HOUR CHART
Makes it 3 in a row…
…inching closer to first target of 14%
Details of trade in the next few hours
Duane
DRFXTRADING
So far so good…
(Represents the period since the start of the new strategy in February)
Latest trade coming from USD CAD…
…4th consecutive win…
…14% target just a few trades and days away…
(February to July 2018 targets. Some targets maybe hit a few weeks after the month ends.)
No need to trade everyday to be profitable.
No need to trade hundreds of times per month.
Patient focused trading to pick the best trades is the path to Long Term Trading Success.
Duane
DRFXTRADING
43 PIP TRADING GAIN ON USD CAD
Hey traders, how goes it
So this was the latest trade done with the new trading strategy that targets 50 to 70 Pips Per Trade within 24 Hours…

Again, just to recap, it replaces the previous strategy that targeted 100 to 200 Pips. Both strategies depend on the ability to accurately forecast the weekly market direction of each Currency Pair.

USD CAD TRADE SETUP
This latest trading gain took advantage of the strong rally that started in the early part of February this year, as the pair began its movement from Support to Resistance within the very Large Pennant Consolidation of the Daily Time Frame.
LARGE PENNANT SETUP ON THE DAILY CHART

Daily Chart gave a Bullish Signal indicating continuation of the rally
The 4H Chart provided the Entry and Stop Loss to protect the trade.
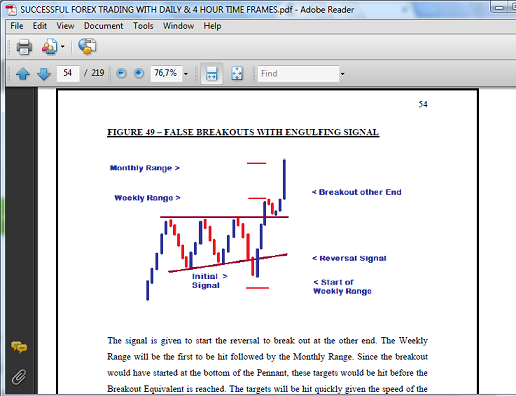
As you see, it reflected the theory of False Consolidation Breakouts
This was the entry setup
And after the end of the holding period, the trade was closed and provided a gain of 43 Pips…
( I analyze the market with FXCM Charts but execute live trades on FxPRo because of their better user interface when executing trades)
Making it 4 in a row
Now as you noticed, the Stop Loss was set at 100 Pips instead of 40 Pips. Exceeding this number is done only if there arent any safe Stop Loss areas ( Support/ Resistance/ Trend Lines) that would protect the trade near to where entry is taking place.
Also, the original target was 50 Pips. However, by the end of the 24 Hour Time Limit, target had not yet been hit. Whenever this happens, I highly recommend you always close the trade no matter how close or far it is from target.
What I discovered was that 90% of 50 to 70 Pip moves take just 24 Hours to hit their targets. After this period, you run the risk of the market pulling back and erasing your gains…
MAIN ASPECTS AND CONCLUSIONS OF THE TRADE
Candlestick Patterns are all we need to trade the Forex Successfully.
Knowing the types of patterns that provide good opportunites is key.
Trend Lines and Support points above Consolidation Resistance can provide safe Stop Loss Areas.
An exception to the Stop Loss Pip Limit can be made but…
Always obey the holding period rule to avoid being greedy in this unforgiving market.
Duane
DRFXTRADING
TURNING YOUR NEGATIVE ACCOUNT AROUND
Between Nov 2017 when my Live FXPro Account was opened and January 2018, it was down by 12% as I experimented to create the new strategy now being used.
With the new strategy finalized and tested, between February 1st and now, it is already up 10% to all but erase that loss in just 6 weeks - from just 4 trades…
So not only is it likely that the average annual gains from the previous conservative approach will be exceeded…

…the new approach is likely to do so in just a few months before doubling those gains in half the time…
The reason why this is likely to take place is that my approach continues to use the reliable Daily and 4 Hour Charts and the accurate Candlestick Patterns, but with a more aggeessive approach to increase turnover each month.
The previous approach that provided 40% on average was focused more on finding safe, reliable setups to generate large gains over the Long Run. While these were good returns relative to industry benchamrks (BarclayHedge), what I disovered was that
The Reliable 100 to 200 Pip Trades were becoming harder to find because of changing market conditions.
The market offered equally reliable setups that provided smaller gains per trade.
Only 24 Hours were needed to capture these gains to cut down the waiting time and the uncertainty associated with holding trades for long periods.
So the last 14 months were spent Demo and Live Trading to come up with a more aggressive approach that was equally reliable, but with faster turnover. In coming up with the new strategy, it was important that it met existing and new criteria…
Did not require long hours staring at the computer (Reduced Stress)
Did not require trading several times per week (More time to recover and spend outside of trading)
Had a defined holding period within which targets are expected to be hit 90% of the time ( Less Uncertainty)
The specific combination of Signals are able to predict market direction and hit the Pip Targets 90% of the time.
Strong Stop Loss Areas of the Daily and 4 Hour can be used to protect the trade.
Continued to rely on Japanese Candlestick Signals and not complicated Indicators or unreliable short term Economic Data.
Did not require checking on the trade until the they were closed.
Having satisfied these criteria, the methodology was finalized,.tested in the Dukascopy Contest ( where I continue to use it) and implemented on February 1st with good results and supporting statistics so far…
So whether you have a good strategy or a losing one, recognizing its drawbacks and making the right changes will make a big difference in turning around any negative returns on your account to allow you to set your sights on even larger Returns over the Long Run.
Duane
DRFXTRADING
MAJOR MARKET REVERSAL AND TRADING LOSS AVOIDED BY SPOTTING DIFFERENCE BETWEEN WEAK AND STRONG CANDLESTICK SIGNALS
The AUD CHF had given a Bull Signal on its Daily Chart this week indicating the possible start of a rally as part of the formation of a Consolidation Setup. However, instead of providing us with a strong Bull Signal on the 4 Hour Chart to continue the move and provide us with an entry opportunity, a weak one was given. This led to the decision to avoid trading this setup because of the possibility of a reversal and loss, which is exactly what would have happened had we traded it.
Avoiding this trade helped to not only avoid a loss but to also keep the winning streak intact since the start of the new strategy in February of this year. The ability to make this distinction between weak and strong signals is a major advantage of my strategy and one which will make a big difference in profitability in this challenging Financial Market.
AUD CHF DAILY CHART
4H CHART
Duane
DRFXTRADING
Hey traders how goes it?
Latest result came from the EURO JPY to get a 100 Pip Gain - in just 18 hours.
…pushing return to 13% in 3 months since the start of new strategy in February.
…with great supporting statistics…
…and closing on the first of 6 major return targets…
PREDICTED SETUP
AS PREDICTED
(FXCM Charts are used for my analysis, but I trade using FXPRo - better interface)
MAIN TRADING THEORIES INVOLVED
BEAR CROWN SETUPS
Bear Crowns or Head and Shoulders are very common market patterns that lead to trend changes. However, as was the case here, sometimes the Right Tip will not be formed and the market will continue the new trend with ordinary single candles.
PREDICTING THE FORMATION OF CONSOLIDATIONS
There are certain market patterns that tell us when the market is forming a Consolidation. Once we spot this early and can identify a string entry signal, we can take advantage of this until the Setup is finally formed.
FALSE CONSOLIDATION BREAKOUT REVERSALS
These are another way in which the market will start new trends. There will be an attempted break at one end of the Consolidation followed by a sharp reversal that starts the break out at the the other end.
Check out the video analysis.
Traded it as well?
Duane
DRFXTRADING
TREND LINES AND STOP LOSSES
The greatest challenge that faces most traders is where to place our Stop Losses. Most traders can spot and identify a trade and predict where the market will be headed but often get stumped when it comes to where to place Stops to ensure we stay in the trade unttil the target is hit.
There is nothing more annoying than seeing the market hit your predicted target after being stopped out too early.
TREND LINES AND COUNTER TREND LINES
Once these are strong enough and are part of a clearly identified trend on the Daily or 4 Hour Chart, you can use them to protect your trade as was done in the recent EURO JPY trade.
These must be placed at a comfortable distance above these lines so that they are not affected by temporary spikes that can threaten our trades.
Nevertheless, identifying Trend Lines is still just one piece of the puzzle when it comes to trading. We will still have to answer/solve the following challenges that are crucial to consistent success whenever the market presents a trading opportunity…
Which Trend Lines are Weak vs Strong & Reliable Ones?
Is the Trend a Temporary or Longterm one or just long enough to get a good trading gain from it? This means that even if your Stop Loss Area is strong, it will still be taken out if the trend was shortlived and the market reverses to start the real trend.
Should you adjust your Stop Loss or keep it at the same place until the target is hit?
How do you address these issues in your trading?
Duane
DRFXTRADING
IDENTIFYING MARKET DIRECTION AND TRADING TARGETS
Hey Traders
Identifying Market Direction and Trading Targets are the main challenges to Forex Success. However, I believe that once you have a system and set of steps to accurately pinpoint where the market is headed, you will be better able to pick the right number of Pips to capture, where to place your Stop Losses and exactly when to exit your trades for Consistent Long Term Success.
The following graph and video explain my recommended approach using the recent 100-Pip trade on the EUROJPY on my Live Account.
Duane
DRFXTRADING
Hey Traders
Todays Video Lessons…
EURO NZD PART 1
EURO NZD PART 2
GBP CAD
NZD JPY
CAD JPY
Regards
Duane
DRFXTRADING


