Video Analysis of the Daily and 4 Hour Charts

This aggressive trade on AUD USD today shows how to trade Consolidation Breakouts ahead of market reversals. The width of the Consolidation predicts the Breakout distance of these Setups & helps you accurately set your trading targets with greater confidence for maximum results.

Was also an example of Fast Breakouts from Consolidations…some are fast…others slow amd tske their time offering multiple entry opportunities…

Duane
DRFXTRADING

Take a look at these Daily Chart Forecasts and compare them to what you see now on your Trading Platforms. Lets see how much money we can get from them this week as they head towards their Support & Resistance Targets.

Duane
DRFXTRADING

Video here shows how I took advantage of the Bear Crown /Head & Shoulders Pattern on the 4 Hour Chart of the CAD JPY to capture 50 Pips and a 4.98% Rate of Return.

Video also explains my Stop Loss Placement and Trading Target and the Holding Period for these trades of 24 Hours thats in sync with my strategy.

WEB FRONT STRATEGY 50-70 PIPS GRAPH RISK REWARD

HEAD & SHOULDERS PDF

This pattern is very common when it comes to trend changes. Once spotted early enough with strong signals…large and quick gains are possible.

Duane
DRFXTRADING

Hey traders

Check out this market forecast I did for a few pairs earlier this week which also highlights the main Technical Factors needed to master trading on the Larger Time Frames.

1. Uptrends and Downtrends

2. Patterns that indicate the transition from one trend direction to another.

3. Patterns that indicate the end of a trend before it starts to change.

4. Main types of Candlestick Patterns to trade.

5. The various types of Consolidations

6. The ideal Holding Period for 50 to 70 Pip Trading Targets…

Duane

DRFXTRADING

Hey traders

Check out another trade made on the AUD USD last week as we took advantage of the False Consolidation Breakout on the Daily Chart of this Pair. (Video to follow).

This reprensented a Rate of Return of 3.82% on my Live Account and depending on the level of Risk that the traders I help use, it would have represented a Return of between 2% and 5% on their trading accounts.

This trade also followed the CAD JPY trade we captured of 50 Pips that we got earlier that week, which represented an even larger 4.98% Return on my Account.

These are the types of Return Targets Per Trade that you should aim for as they will allow you to achieve significant Return Targets over both the Short-Term and Long-Term…

WEB FRONT 30% MONTHLY RETURN 6 MONTHS 383%

What we did was to trade the Pair Short at the Bearish Engulfing Candlestick Formation on the Daily Chart as it continued the False Consolidation Breakout Reversal that was taking place. This Downtrend was projected to be part of the formation of a large Pennant Consolidation Setup.

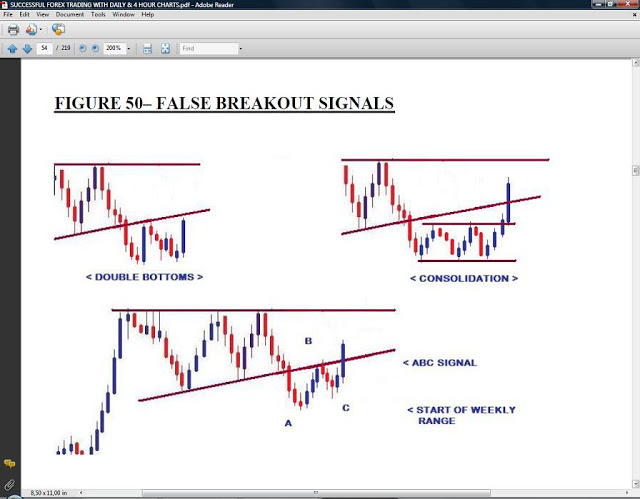
False Breakouts are one of several setups and Chart Patterns that start trends and usually move quickly. The breakout will fail at one end (in this case Resistance) and then start the breakout at the other end. Signals such as Bearish Engulfing Candlestick Signals allow us to take advantage of these trends.

ADVERTISING - FALSE BREAK REVERSAL FIG 49

WEB FRONT FALSE BREAKOUTS GRAPH MANUAL

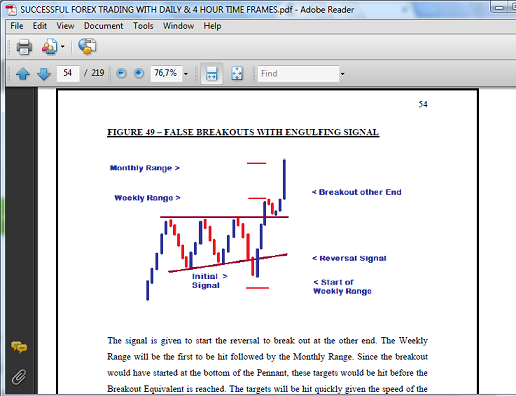
Once this was seen, an Entry Setup was opened using the 4 Hour Chart. The Stop Loss was placed above the Downtrendline to protect the trade with the target set for an area just above the 0.7020 Support Price.

After 48 Hours, I decided/recommended to adjust the Take Profit Order to exit the trade at 0.7037 instead of 0.7025. This gave us 70 Pips instead of the 83 Pips originally targeted.

As you can see…the Stop Loss was not affected by the temporary pullback that took place. This was because it was placed far enough away from entry and above the Downtrend Line - an area that usually protects your trades once it is strong enough and on the Larger Time Frames…

So this was another example of how False Breakouts can be traded. Once it is clear and the Signals and Setups supporting them are strong and clear enough, they can be traded for strong gains every time.

It was also another example of the Aggressive Strategy now being used. Most trades are 50 to 70 Pips over 24 Hours…but sometimes 48 Hours are used to capture larger targets.

WEB FRONT STRATEGY 50-70 PIPS GRAPH RISK REWARD

Duane
DRFXTRADING

This kind of breakout pattern is my favorite one since the level is so clear & I get the proper idea on entry level.

Especially when used on the larger charts…clearer and more reliable setups and signals

1 Like

Exactly like H4 & D1. But, I need to wait for this kind of dream pattern since, it’s not available here & there.

Hey traders

This 50-Pip Gain on the NZDCAD pushed my Live Account to a 16.76% Return in just 5 Weeks, proving that Large Returns are definitely possible from the Forex in a short time.

It took advantage of the Consolidation Setup being formed on the Daily Chart, supported by the Bull Crown on the 4 Hour Chart.

Below were the setups and predicted rally on the Daily and 4 Hour Charts. The Daily had given a Morning Star Bull Signal while the 4H had formed a Bull Crown, breaking the Downtrend Line to start the Uptrend

This was the Entry Setup for the trade…

…Stop Loss was placed below the Uptrend Line and the target set for an area just below Resistance.

After a short time…target hit as the market rallied as expected…

As usual…FXCM Charts used for analysis and entry signals but my Live Trades done with FXPRO…

This trade was essentially an example of trading the early trends that form Consolidations. Once we can spot them early, we can trade for gains instead of waiting on the Consolidation to be formed to then trade between Resistance and Support.

Great trade, quick result, showing that Candlestick Signals, Trend Lines and Consolisations are all we need…

…allowing us to hit large Rate of Return targets in a short time…

Duane

DRFXTRADING

These lessons are really helpful for all of us. I think 4h is the best timeframe for trading securely as most of the indicators hold there strength on the long timeframes. 4h is my favorite timeframe where I can plan my trades for a whole week. What are your thoughts?

Agree and disagree.

4H is a good Chart to use…less volatility…more reliable Signals.

However, I dont use indicators…prefer Candlestick Signals, Trendlines.

Even though 4 Hour is a great time frame, better to use it with Daily which controls the 4H…

Even though 4H can be used alone without Daily sometimes…the losses experienced can be attributed to you not paying attention to what tge Daily was saying. In other words, if they are both in sync with each other…you can trade the 4 H alone…but if they are in conflict…can cause losses.

Hey traders

Rate of Return now up to 18.1% since the new strategy began on December 18, 2018.

All of this from just 8 trades…

Showing that 14% a month is definitely possible…

.

All things equal…just 3 trades needed for 30% target.

NZD CAD

Essentially what we did was to trade the Bull Crown Setup on the 4 Hour Chart. This was taking place within the Consolidation that was being formed…

Target was set to 50 Pips just below where the market tends to slowdown and pullback before hitting Resistance Point. Stop Loss was placed below the Uptrendline.

Main Points

  1. TRADING TREND CHANGES
  2. BULL CROWN SETUPS
  3. TRENDLINES AS STOP LOSS AREAS
  4. BREAKS OF TRENDLINES

However, to ensure consistent gains, these other points must also be considered when trading these and other setups.

Video to follow for this trade…as well as the one for this most recent one…

We traded tje Bear Crown Serup that started the downtrend within the Consolidation that was being formed on the 4 H…

As stated before, FXCM charts used for my Analysis and Signals, FXPRO used for Live Trades.

Duane
DRFXTRADING

Hey traders

This video highlights some recent trades made on my Live Account that have pushed my Return up by 18.1% since the new approach began in December. I also highlight a trade made on the NZDCHF of 231 Pips in January 2015, just before the sharp reversal caused by the Swiss National Bank.

SNB REACTION NO LIVE NZD CHF 231 PIP TRADE FRON PAGE

(Dukascopy Live Account I used up until 2016. I now use FxPro)

This is done to show you that large returns and consistent gains are possible during both Normal and Abnormal Market Conditions, so long as we use the accurate tools of Candlestick Patterns, Trendlines and Consolidation Setups on the Larger Charts.

Duane
DRFXTRADING

Here are the trades you will see highlighted in the video above that show how I maximized on these Pips offered ahead of market reversals at Resistance and Support Areas.

NZD CAD BULL CROWN

This took place on the 4 Hour Chart as the Pair was breaking the Downtrendline to start an uptrend as part of the formation of a Pennant.

AUDUSD FALSE BREAKOUT REVERSAL

Traded the Downtrend formed as part of the False Breakout and Reversal from that Pennant on the Daily Chart.

CADJPY BEAR CROWN SETUP

Traded this setup on the 4 Hour as the pair transitioned from an uptrend to a downtrend, exiting just before Support Point hit.

EURGBP FALSE BREAKOUT REVERSAL

Market attempted a Bullish Breakout above Resistance of this 4 H Chart Setup, but was taken out by this Bearish Signal. Traded it towards Support for a nice gain.

Duane
DRFXTRADING

Hey traders. Latest 2 trades provided a 6.3% Return this week from the GBP USD (2.79%) and the AUD CAD (3.4%).

Both involved trading Consolidation Breakouts towards Major Support Points, with the AUDCAD trade showing the importance of spotting these Support areas so we can maximize on gains and exit accurately ahead of Market Reversals to avoid losses!!

THE AUDCAD TRADE

This shows that a 30% Return Monthly is definitely possible for you.

WEB FRONT 30% MONTHLY RETURN 6 MONTHS 383%

Video to follow.

Duane
DRFXTRADING

Hey traders,

This Video describes how to successfully trade Double Top Patterns that are very common across the Forex, but which can lead to unexpected losses and reversals if we try to trade them too early! I use the trade done on the GBP USD last week as an example to describe these Profitable Patterns.

Duane
DRFXTRADING

Whats up all!!

Today’s Video Lesson takes a look at how to Master False Consolidation Breakout Reversals. A recent trade on the GBPJPY is used to describe these setups including how to draw Support and Resistance Lines correctly, the Candlestick Signals that normally start them, Stop Placement and Trading Targets.

All of this is done in the context of solving these 5 main Challenges that face us each trade…

Any questions? Let me know.

Duane
DRFXTRADING

Does the Forex always seem to suddenly take away your trading gains with Sharp & Unexpected Reversals that come out of nowhere? If so, then you are either not aware of the major Support and Resistance areas of the Larger Charts or do not obey them and become greedy. Using a trade done on the GBP USD, this video will show you why you must always exit your trades at these areas to ensure you avoid these painful trading losses!!

Duane
DRFXTRADING

Hey traders,

Another Video Analysis from my Live Trading (AUDCAD 3.41%) that shows how I trade Consolidation Breakouts that take place on the Larger Charts.

I also WARN against trading the Smaller Charts that can cause you to miss the major Support/Resistance that lead to Sharp Reversals and Trading Losses!

Duane
DRFXTRADING

Hey traders

Trading Gain of 2.97% from the,EURJPY took advantage of Yen Strength across the Forex this week and showed us how to take advantage of Bear Crown Setups for Fast and Aggressive Trading Gains!

Trading is done both on a FXCM Demo Account (better charts, used for market direction and signals) and my Live FxPro Account (better interface when making trades) to show that there is no difference between Demo and Live Trading Results - as long as the strategy used is Sustainable, Realistic and Profitable.

Questions on this setup welcomed.

Video Analysis to follow.

Duane
DRFXTRADING