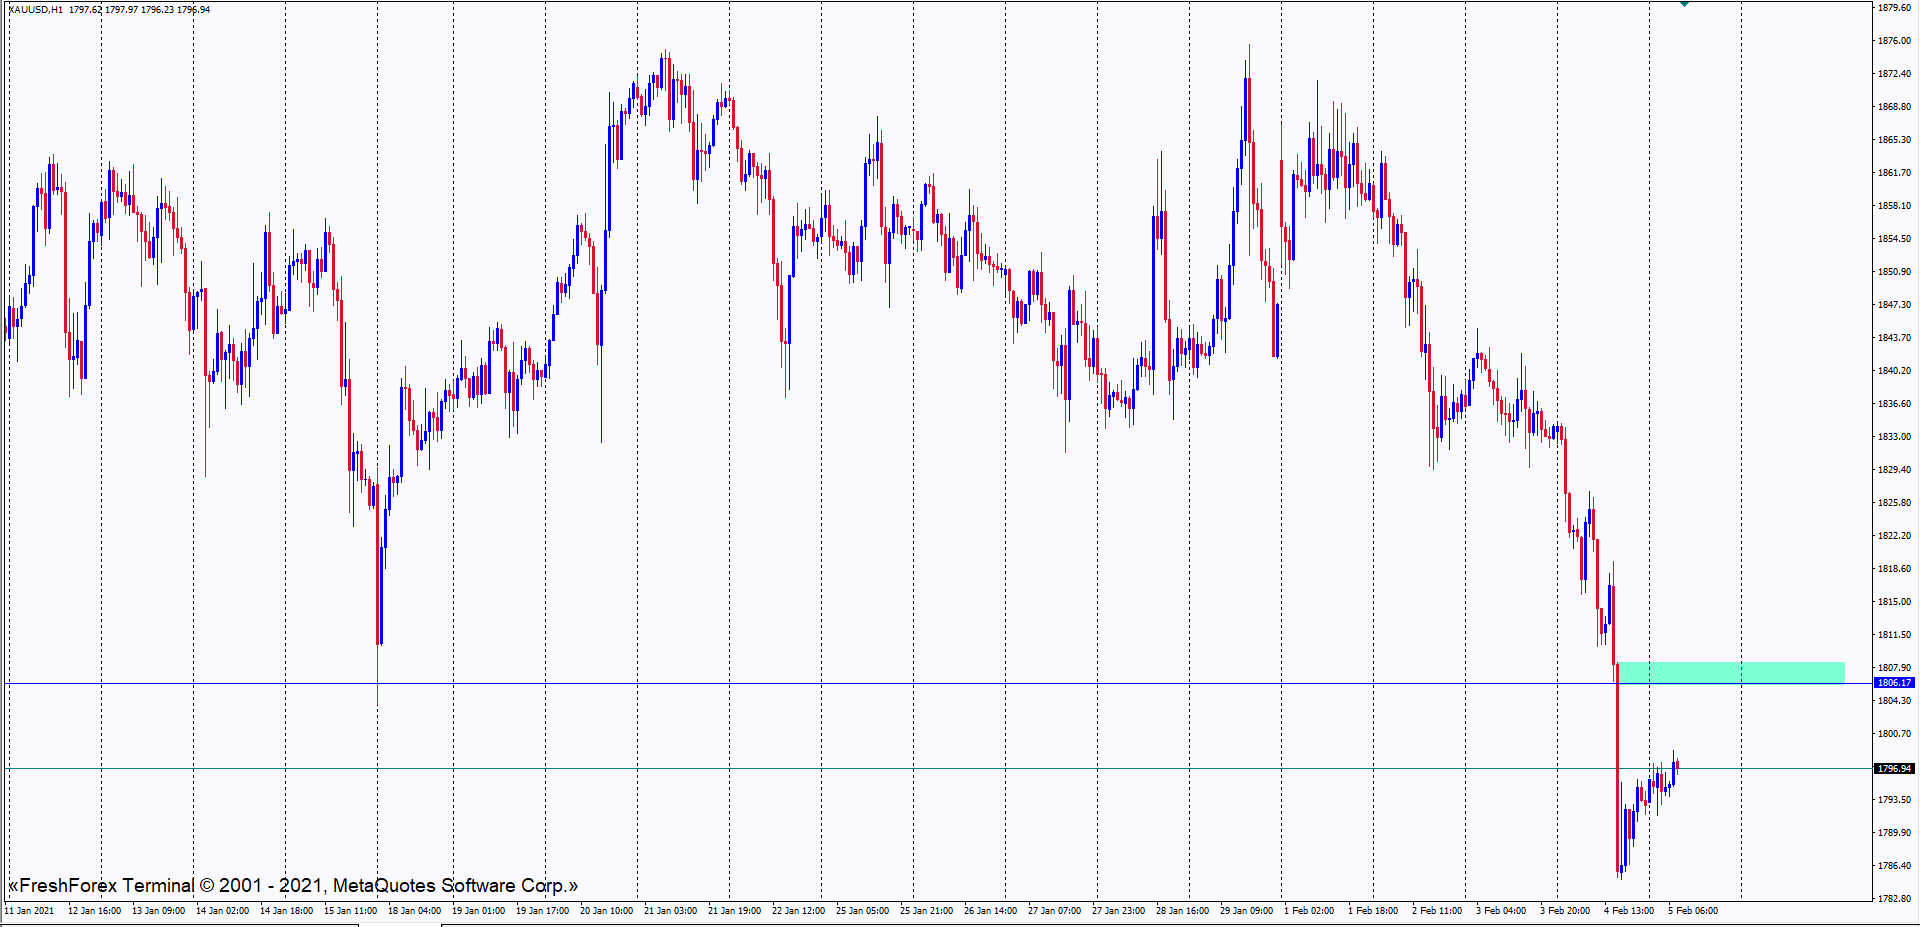
Update on Gold where there was a gap this morning (GMT+8), indicating a strong buy is still happening. I am still waiting the price to touch either these supply areas. The first one correlates well with strong resistance. Try to look to the left. The second one is to decide whether the price would break the downtrend or to continue it.

Also another update on GBPUSD where the price is near the supply area. Try to look for price action on the lower timeframes. This can be a long term selling opportunity for the year.

Thanks man! Appreciate it. Happy new year to you too!
1 Like
You are very welcome. Consider to check on another USDxxx pairs as it has the same low level. I might watch all of them for long term buying opportunities.
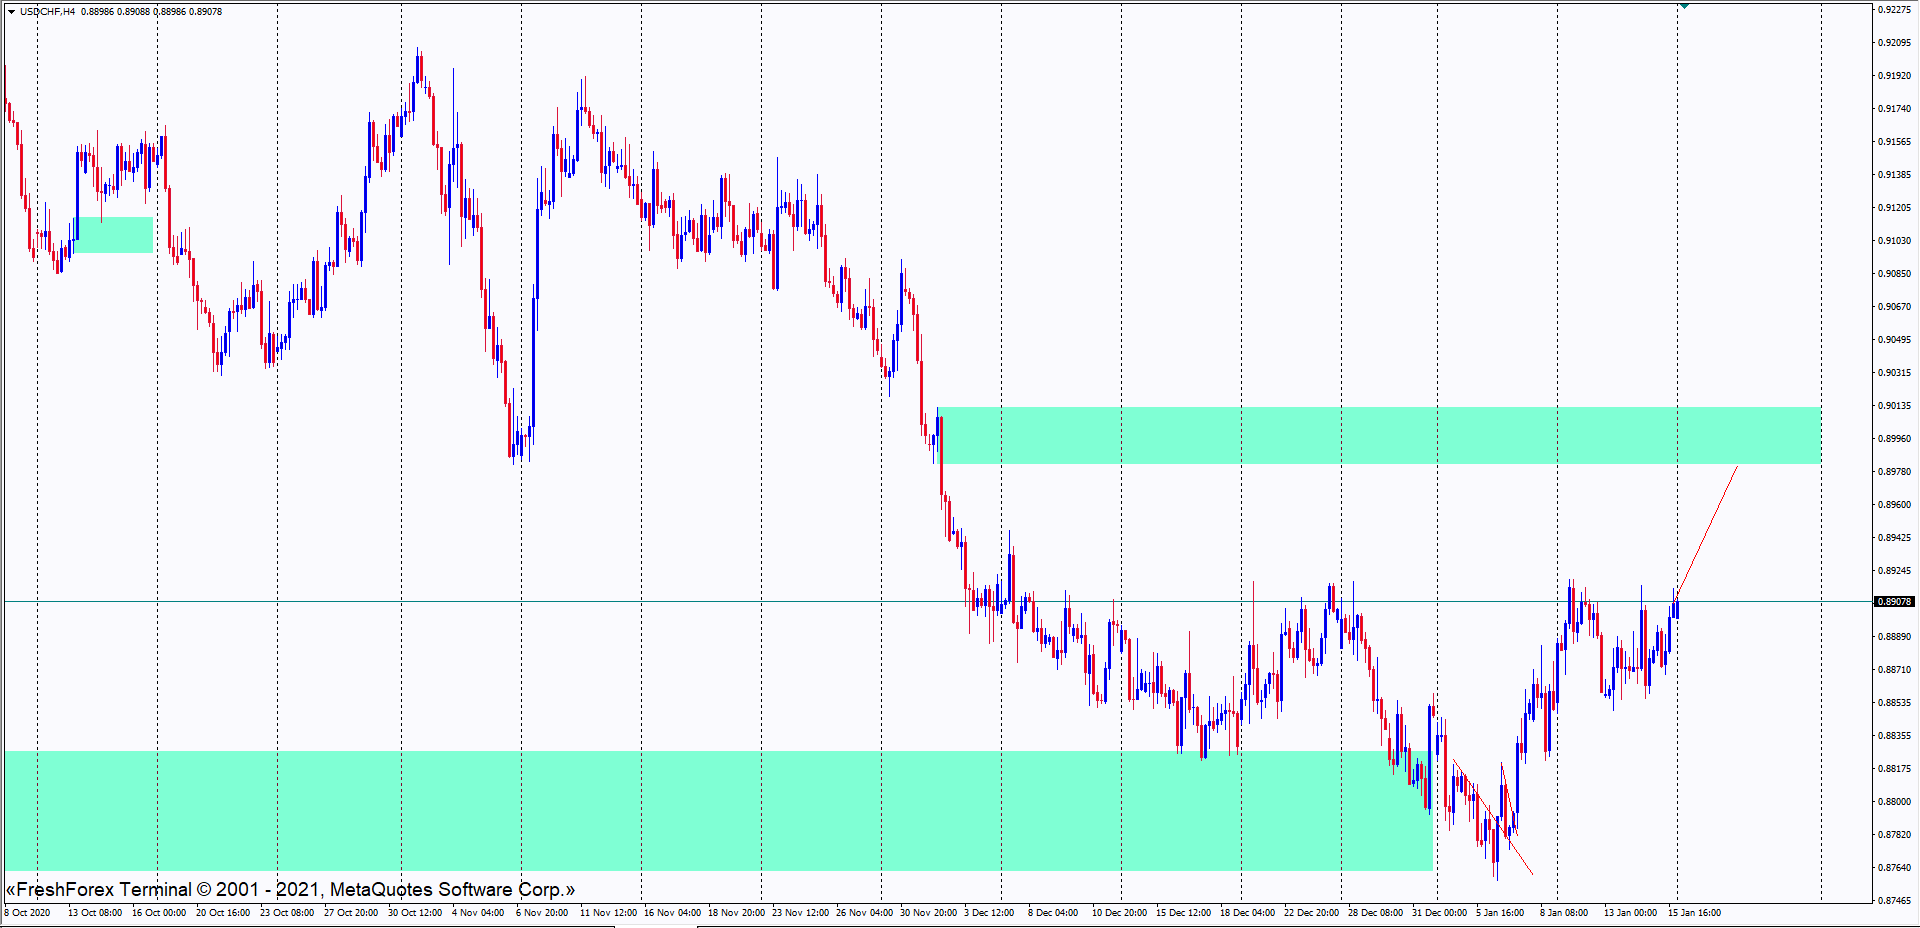
So, another week to see the updates from several pairs. I will try to keep it around major pairs. But if there is any golden opportunities, I will update it here also. Let’s see what USDCHF has to offer, moving up till this supply area and wait for selling confirmation.
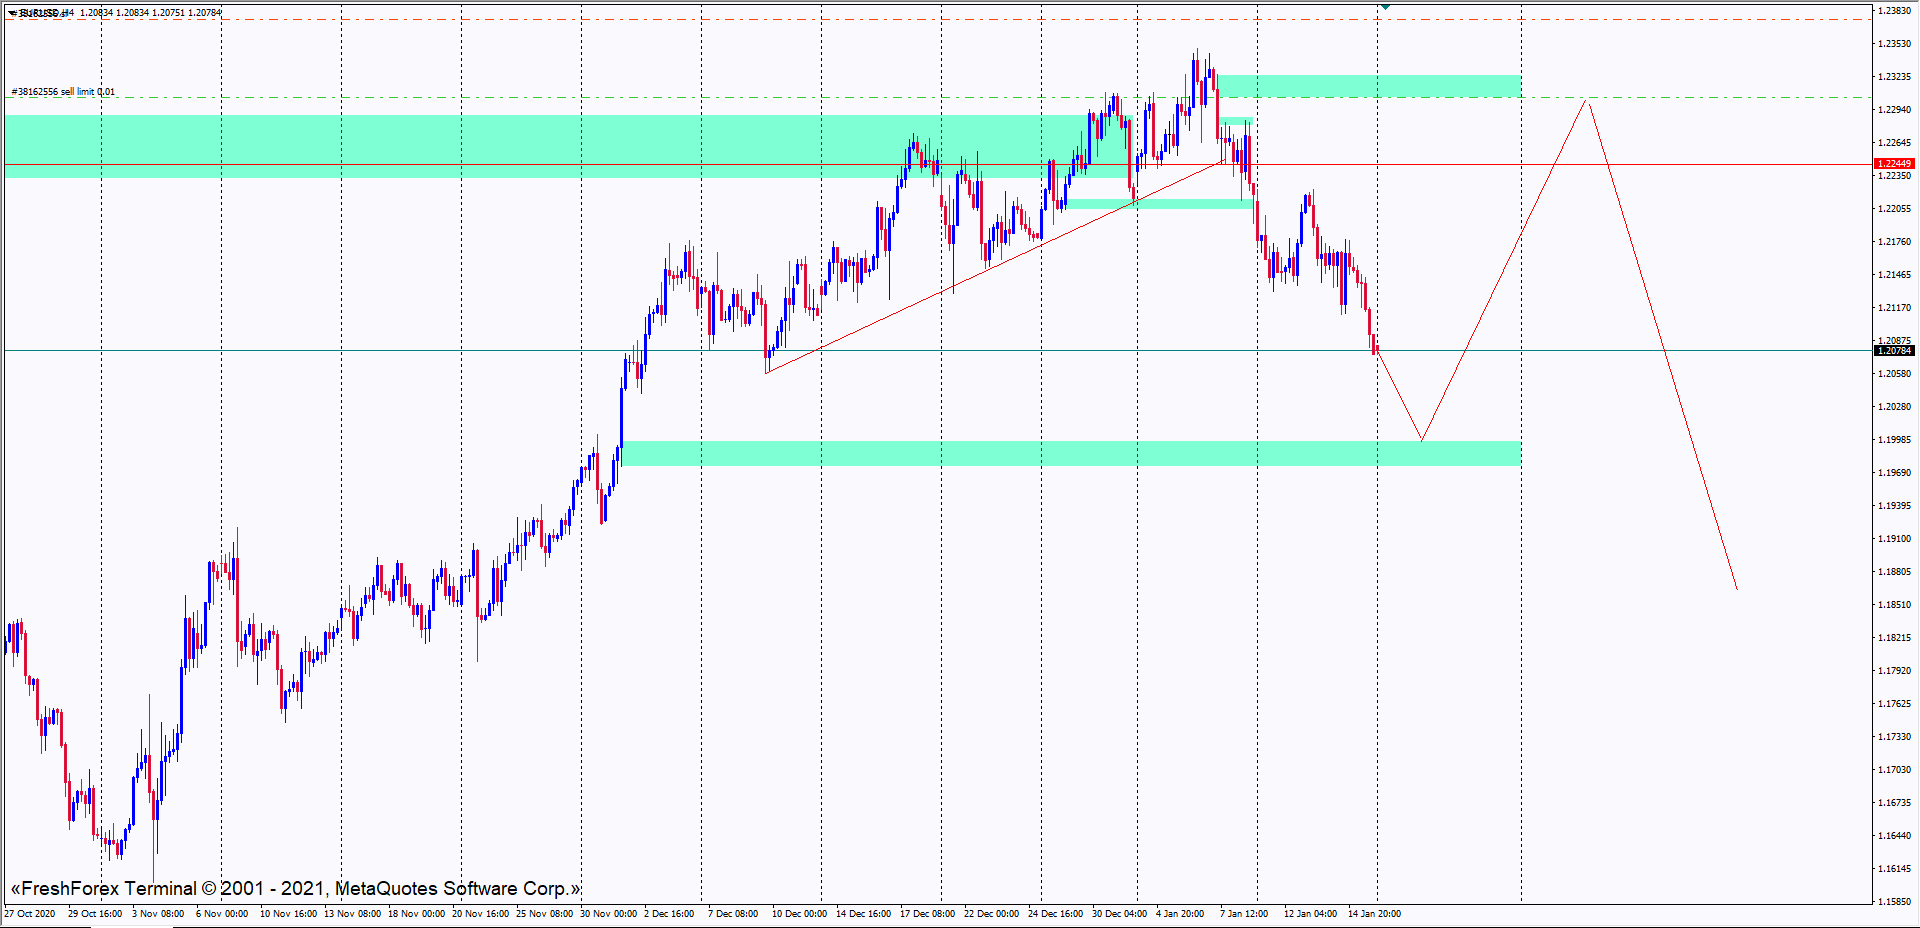
Another one to consider is EURUSD where the price is currently going down. This might be a change for the main trend. You can look for selling price action in lower timeframes.
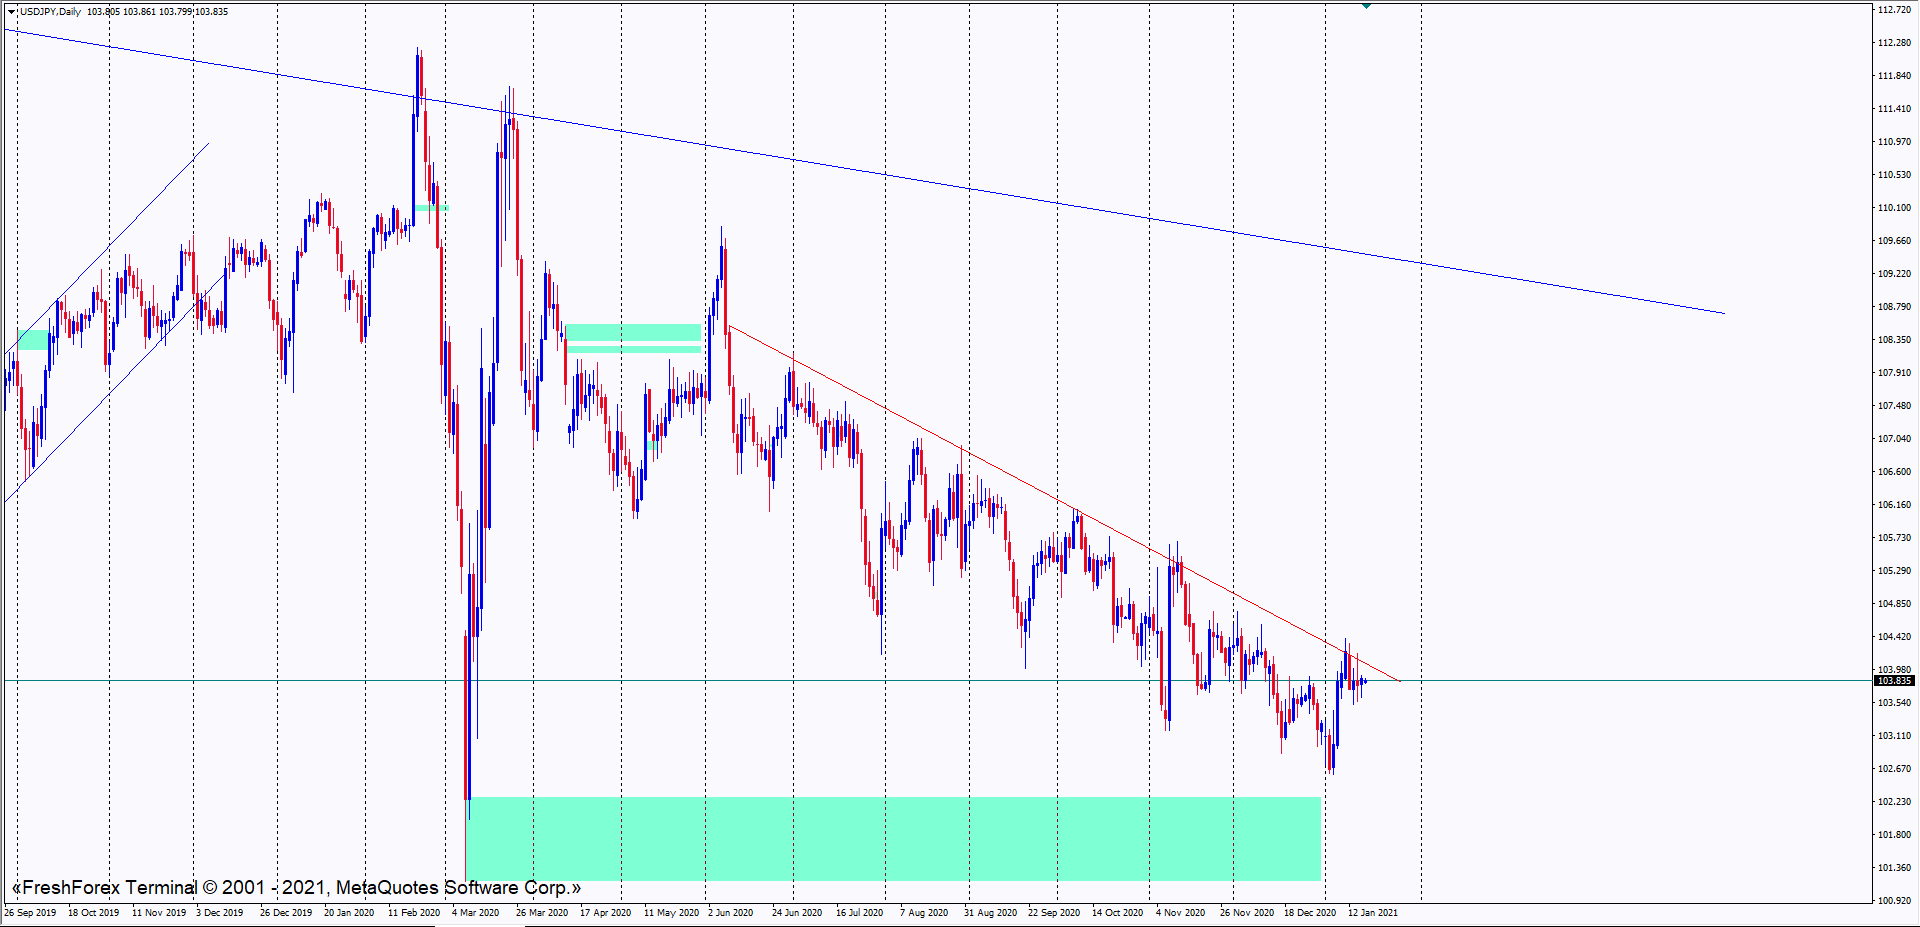
Another update on USDJPY where the price is still moving on its compression. The buying opportunity later will yield big pips on short amount of time. Be on look out for this pair.
This week is the final week of the month. Let’s see what GBPUSD has to offer when the price hits the supply area on weekly timeframe.

This is another view of GBPUSD on H4 timeframe. We will see any price action confirmation on this timeframe as this sell setup would be a long term setup.

An update for EURUSD as the price didn’t hit the demand area, making it a target for our sell setup. We will wait this week, hopefully the price will hit the sell limit I put there.

Who loves Gold? Looks like the price is going for another pullback and I will wait around this area for the long term setup. We will see…

Want to learn something new? Check out two of major pairs that are pretty much correlated. Let me show AUDUSD first.


Things you can learn from both pairs: they are both similar in terms of trend and movement pattern. Although you can not put both orders on similar price point, but at least you can apply the same analysis on both and entry when the time comes.
Hi,
You could make the mistake of considering two trades - one in each pair, but because of the correlation, that would be the same as one trade at twice the risk. Just a word of caution. I’d be more interested in seeing examples of when the NZD and AUD ratios to USD diverge, not when they correlate, and the reasons for divergence. That would make a more interesting case for set up and entry.
Hello
Couldn’t agree more with this since setups on both pairs can be so different. But if it’s (let’s say) based on a couple of hours before important news for USD, we can try to look for the same selling/buying setups there. The thing is that it is pretty much depending on the setups before executing the trades.
Now let’s see what major pairs have to offer right before NFP. Make sure to manage the trading lots right since it would be a bit risky in terms of volatility. First is Gold where you can try to sell around this area. Reentry right after the price breaks the trendline
The second one is NZDUSD that broker the trendline yesterday. Now is the chance to reentry the sell somewhere around this area with SL around 30 pips above

You can also try to reentry the sell on GBPUSD on this supply area. The SL itself it still pretty neat on somewhere around 30 pips above

Looks like this month’s NFP wasn’t the one to move USD stronger. But if you see the pattern on USDX, now it’s the time to look for the opportunity to surf with USD