I dedicate this post to share my view toward the market through Supply and Demand perspective. This means no indicators involved here, just area markings on certain levels and you can expect to wait some price actions later… So, shall we begin?
1 Like
Let me share some views on some pairs today for the next couple days. First off is GBPJPY while I can expect a significant selling movement after hitting this area. Also, you can put trendline on the current uptrend to confirm downtrend later own after the price breaking up the line later…

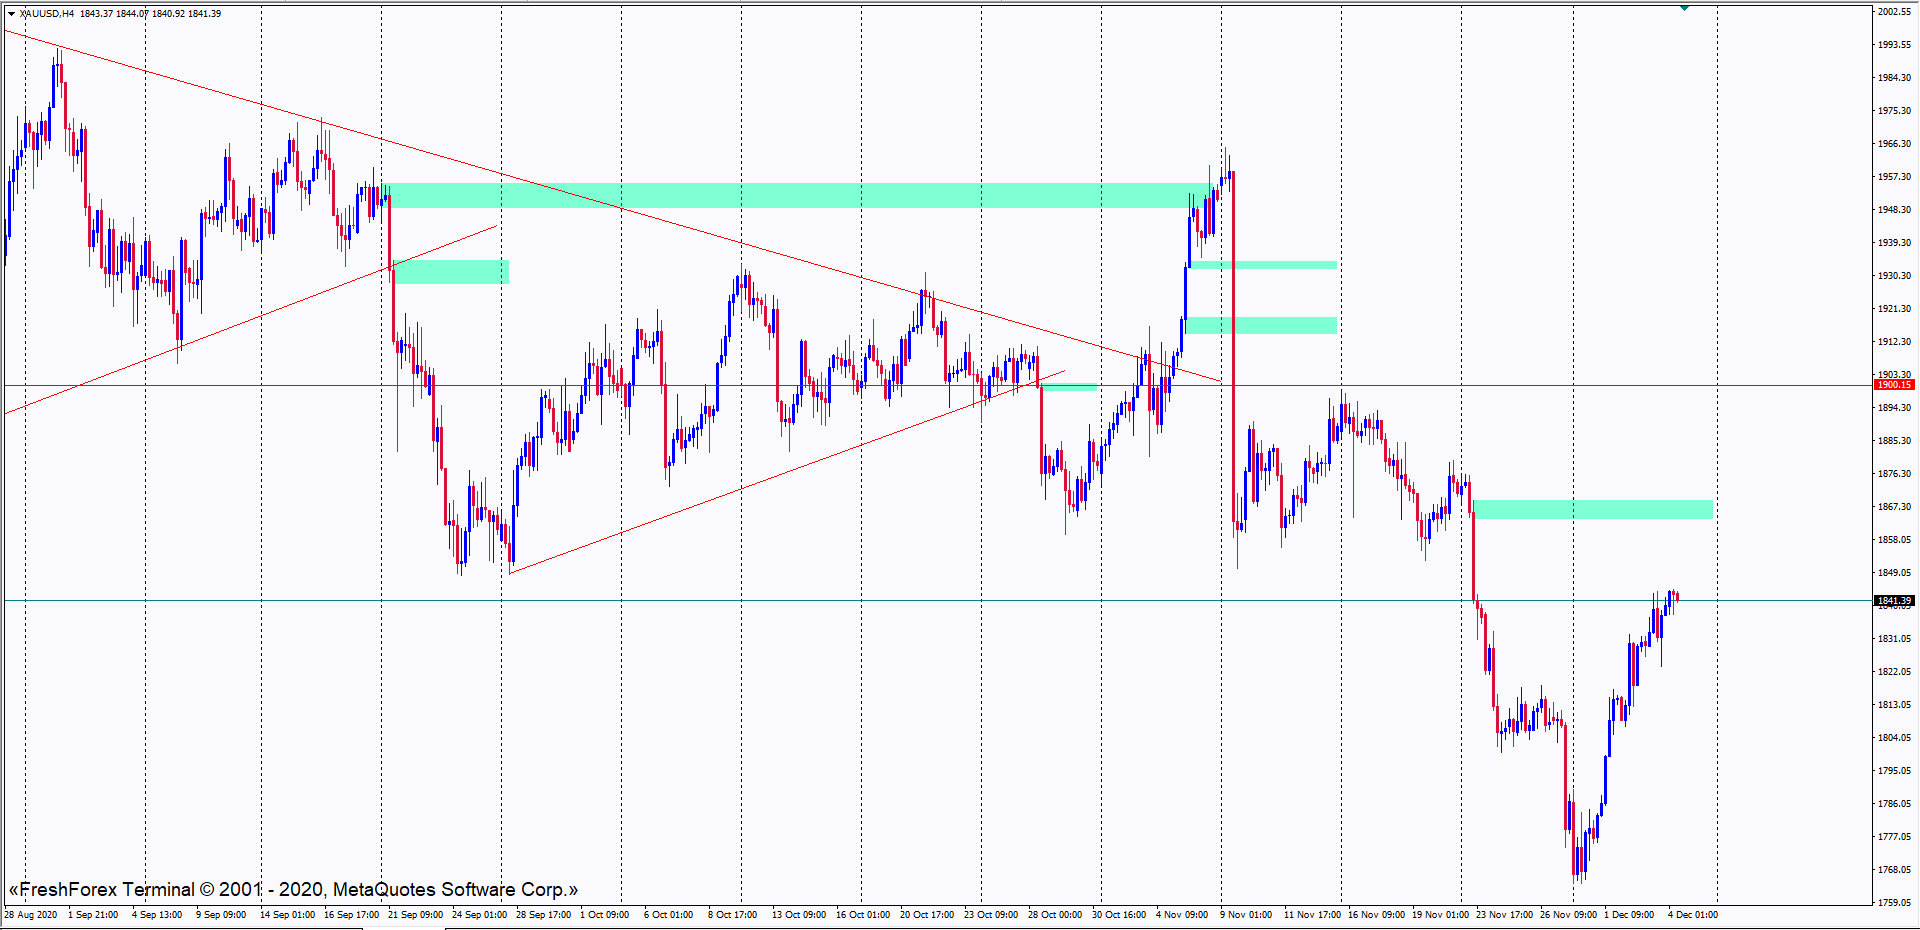
This week on gold, I can see the price is retracing for another selling trend later on. You can expect the price to hit this area before going down. You can also put trendline on the current uptrend just for another confluence of a confirmed breakout. You can refer to this chart, thank you.
Hi,
What input data are you using to determine supply and demand?
What rationale are you using to draw the support/resistance areas?
This was an interesting collection of charts and I really liked the way you’ve summarised the weekly analysis. The GBP/JPY chart is pretty helpful and I’m going to use it to compare it with my other trades. Thanks for sharing these here.
Hi, Mondeoman.
I draw supply and demand areas based on candle pattern, you can refer to several theories given by SamSeiden on ForexFactory (hopefully it is allowed to mention other forums here). Also, he given the theories for the Support Resistance levels. Along with rules of Resistance becomes Support and vice versa.
Hi, Alzarijosephs.
Thank you for your feedback. I cannot guarantee high probability on my own markings, but at least it gives low risk opportunity to be taken. Also, consider this as additional idea instead of main idea for your trading decision.
Another alert for Gold. You may want to take this trade as the price is not too far from breaking the trendline by now. I would rather wait for the H4 candle to close then take the sell. Put SL above today’s high (kinda risky, better calculate your trading lot).

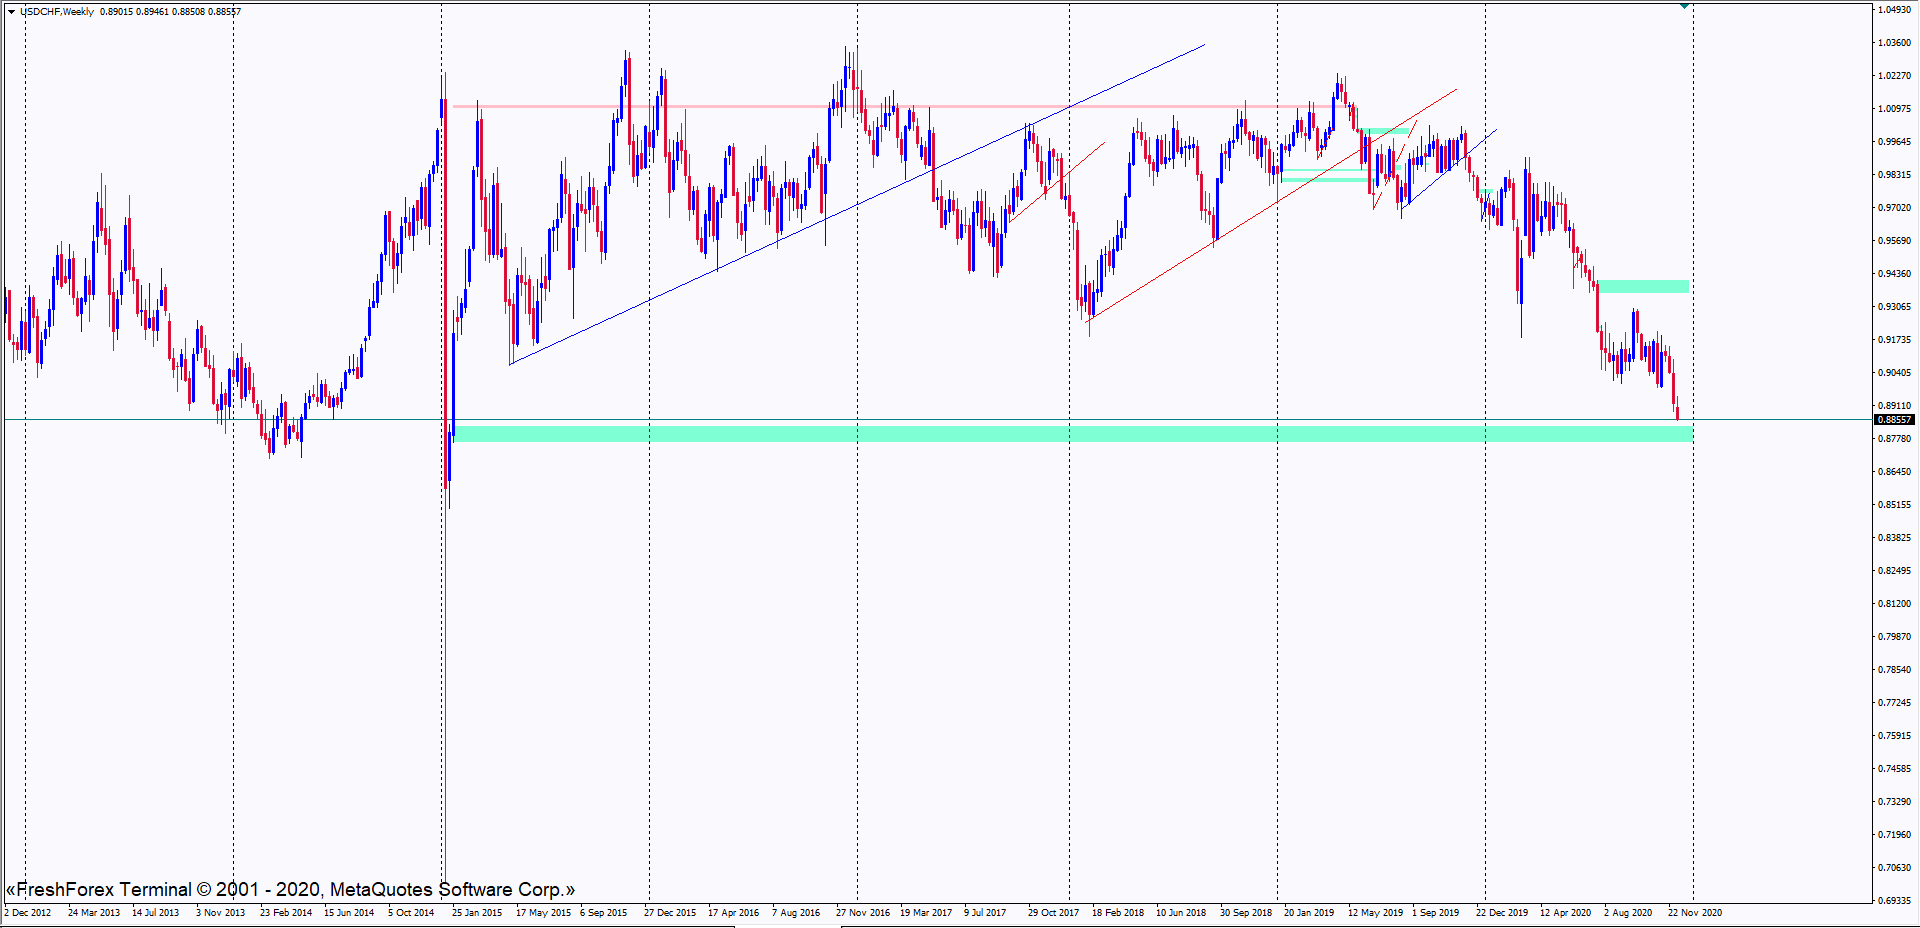
Next is USDCHF where this setup can be happening around early 2021 with confirmed price action. Don’t just put any limits since it’s way too risky (the chart is in Weekly timeframe).
Follow up on GBPJPY. Unfortunately the price did not hit the area I marked last week, but it broker the trendline, retraced and drop even further. Today, the price gapped around 100 pips above and I haven’t seen any other reselling opportunity but to wait for it hit the supply area that I initially marked on the previous post.

A bit unfortunate to what happened to Gold there. But the risk was pretty much calculated with a good trading lot, of course.
Let me put another plan for 2021 as this trading setup will be a swing trade setup. GBPUSD is about to his this supply area along with a good resistance level inside. Better lookout for any price action since the price is rising a bit faster this week.

Another swing setup to consider is USDJPY where you can see a ‘compression’ price action is made the entire year. I will look for buying opportunity around this demand area.

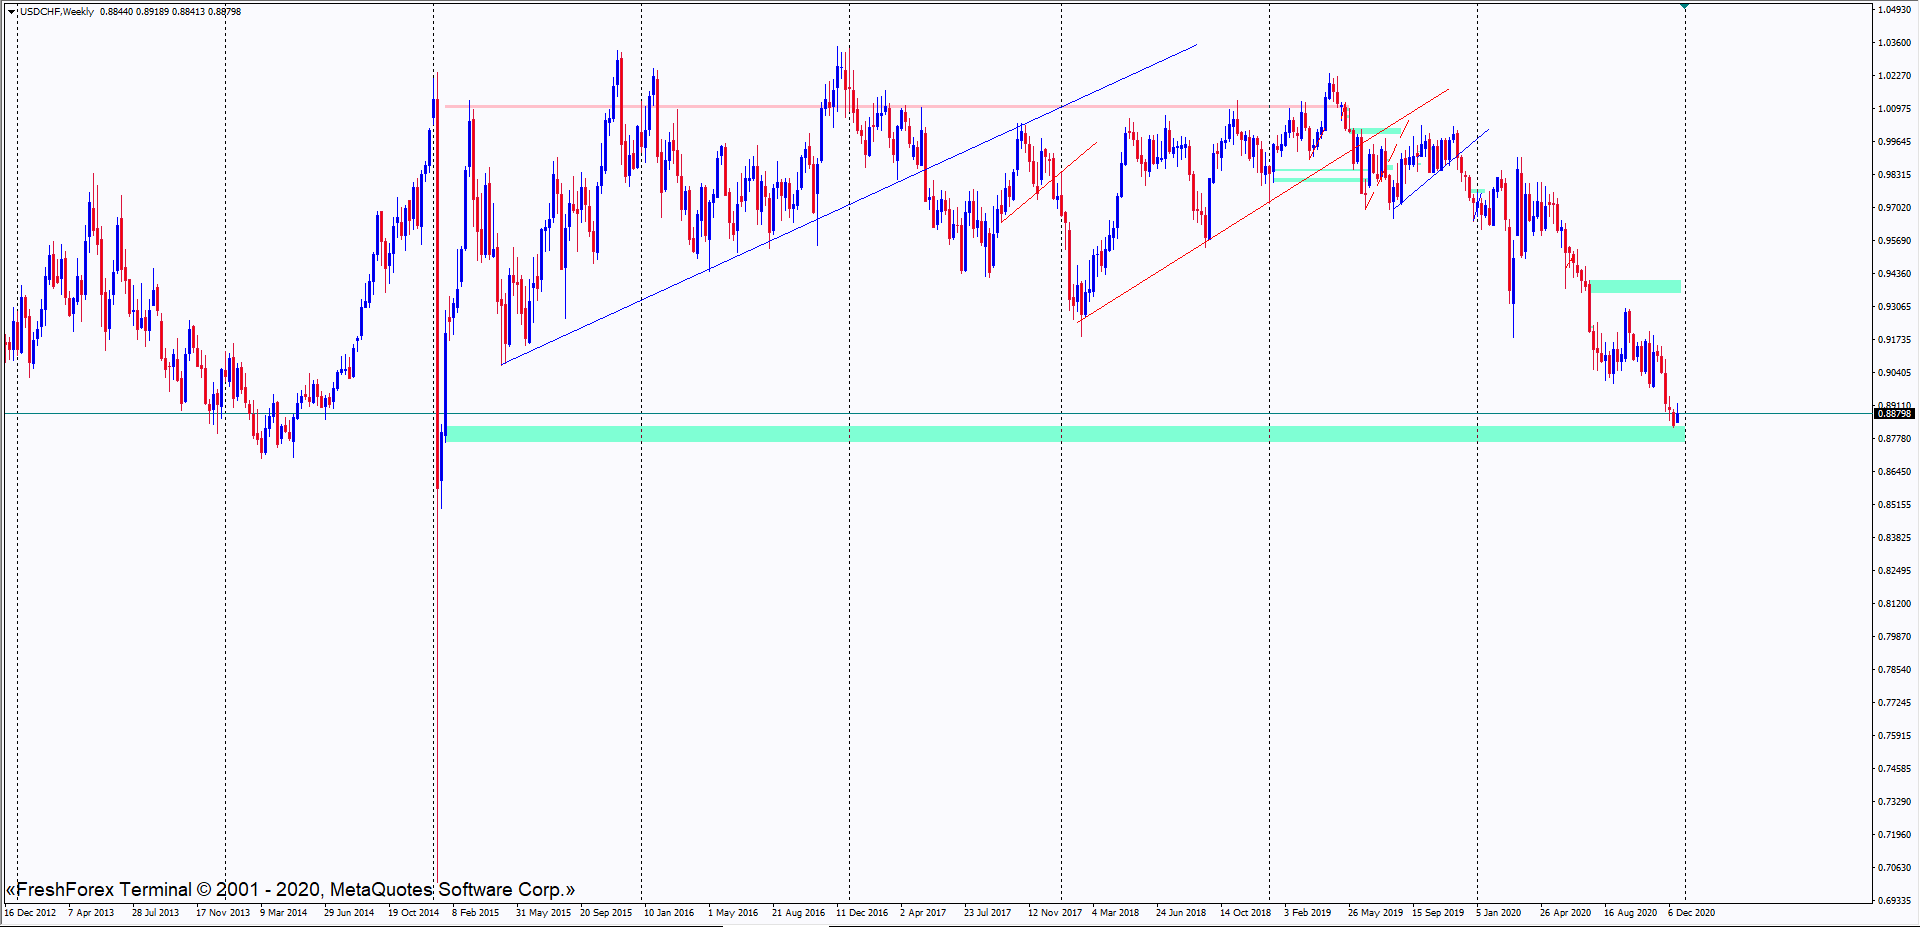
Update on USDCHF where the price hit the demand area last week. In the beginning of 2021, you can look for buying opportunity. Never put and hold any trades around new years eve.
Another pair to consider to wait in 2021, EURUSD where you can look for selling opportunity later on. Check lower timeframes for any price action.

AUDUSD is another one to consider since it is corelated with EURUSD where you can look for selling price action later on lower timeframes.

And so, NZDUSD is giving another hint to wait for the price to hit supply area and the key level there. Just wait and see for now…

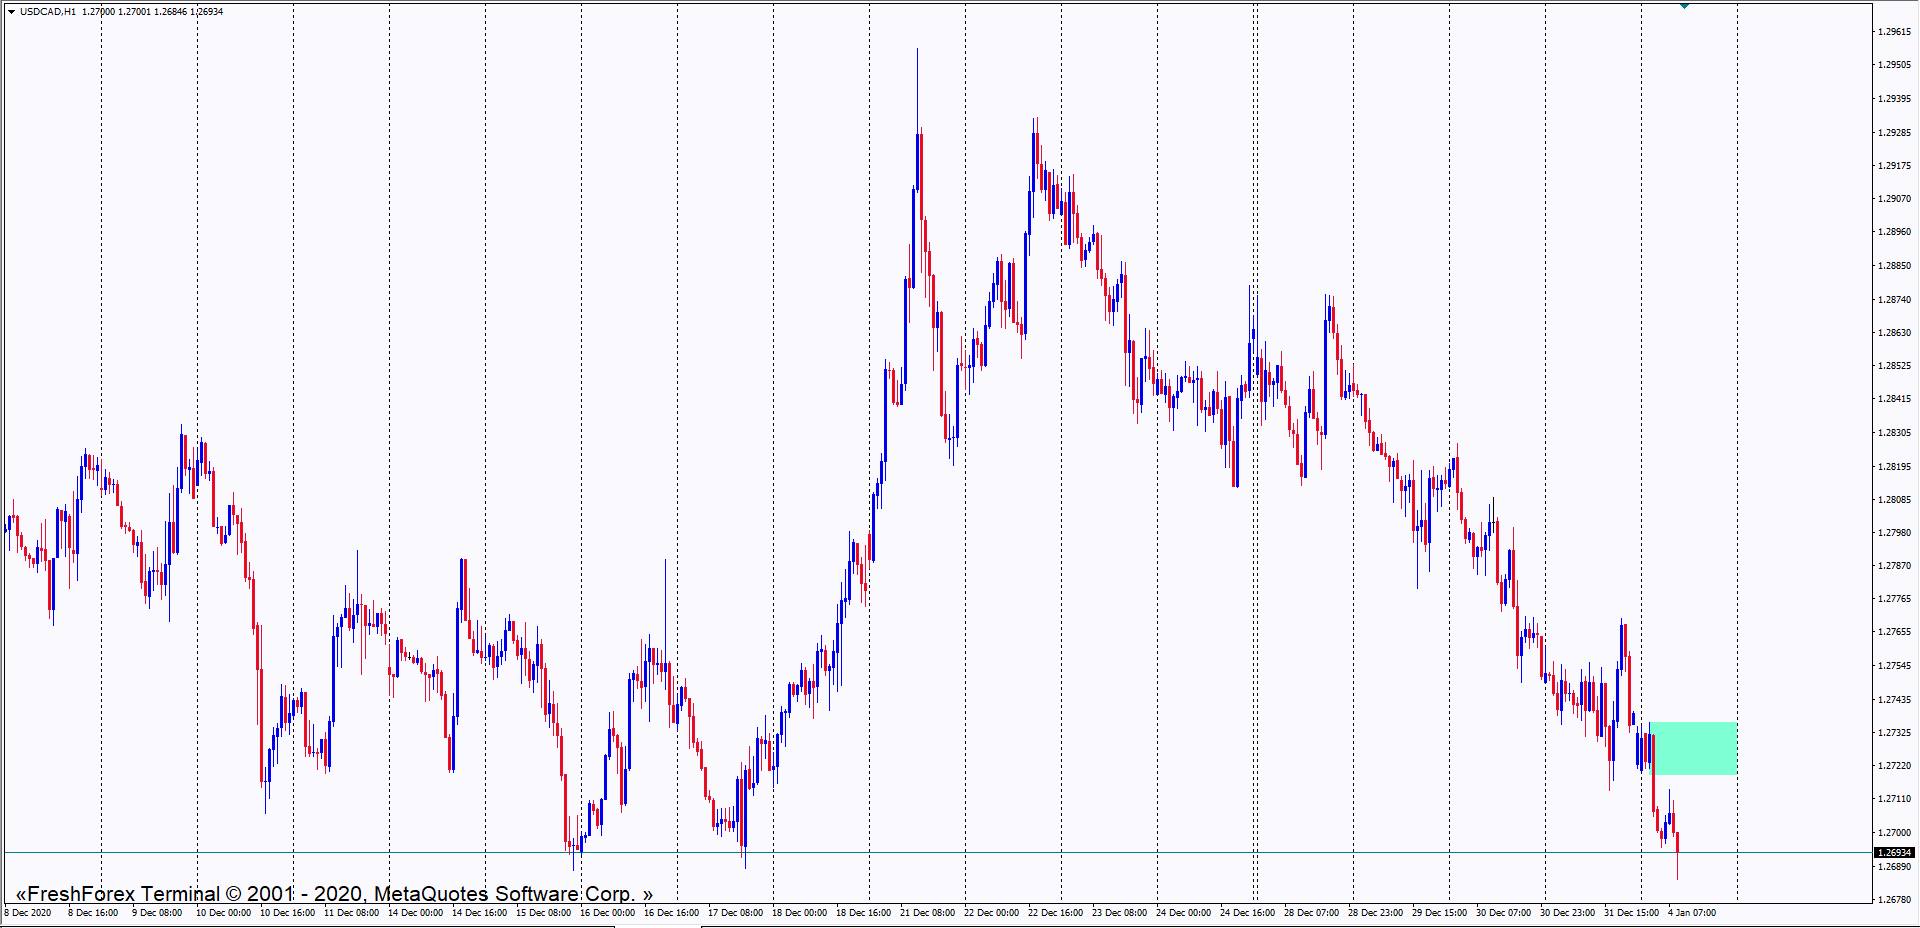
thoughts on USDCAD? i’ve been trying to get in for a while, couldn’t find a good spot.
Hello there… Sorry for the late reply and happy new year!
For USDCAD, I have no strong opinion towards the pair since I can’t clearly seen any areas to wait. But here are my perspective on lower timeframe where you can follow the current selling trend. Just wait for the retracement around this supply area.
1 Like
