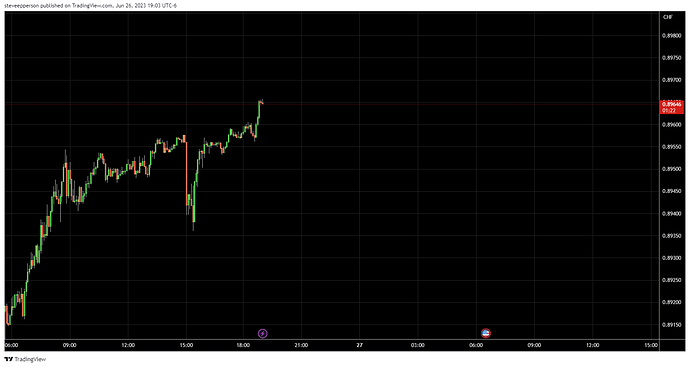
Do you think the indicators are correctly placed? I’m having trouble understanding the trigger. Any insights or explanations would be appreciated!
PS: it is for few days ago
Be glad to help you analyze this chart. If you get rid of all the indicators and lines, you can see that the uptrend created three pushes upward and is now looking as if it wants to reverse. However, it can quickly evolve into a trading range.
Sometimes on Tradingview, it’s hard to tell where the positions are, but it looks like you entered at market here and have set your SL and TP. This is okay, but I would have preferred you set your stop above the highest point on the chart to give you more room. Your TP would be lowered to make up for it.
In markets like this, where you see a lot of TR price action, indicators are useless. For example, you can see the MAs weaving in and out of the candles, not really serving as any kind of support or resistance. Same for the trend indicator you have at the bottom.
As for the yellow horizontal lines, I know you think these are significant levels, but all they are showing are the higher highs and higher lows of the uptrend. You can tell an up trend from a mile away without using lines. For example:
Which direction is the trend? It’s obvious that it’s up, albeit this is a rather ugly example (most FOREX price action is ugly). I asked my four-year-old son a similar question one time, and he got it right as well. He knew the pretty candles were heading upward, so he guessed “up.” He didn’t need exponential moving averages, stochastic indicators, or 10 years studying Elliott Wave Theory. He could just see it because it was obvious.
Your chart is also in an uptrend and looks as if it’s evolving into a trading range. It could also be a legitimate reversal since the last higher low has been breached. Since there is still a great deal of uncertainty with this chart, this is how I would trade it:
- Place a sell limit order just below where you have marked your current SL.
- Set the new SL above the highest high on the chart and account for the current spread.
- Keep your TP where it’s at (the first yellow line). It looks as if it will give you a swing profit (1:2RR).
The sooner you can trade without indicators, the sooner you will gain clarity in your trading.
Or you apply the road less travelled and think outside the square by using another concept to clear your charts…
Moving Average Candles (EURUSD 1 Hour Chart)
Parabolic SAR Candles (EURUSD 1 Hour Chart)
CCI Candles (EURUSD 1 Hour Chart)
Didi Index Candles (EURUSD 1 Hour Chart)
As usual… The simplistic methods are the methods that no one uses…
A lot of traders used to think that price charts found you the right target and an indicator told you when to get in. They were certainly wrong about the indicator part.
Whether or not your indicators are used correctly depends on your strategy. What do you think?
Not familiar with these. Looks great. I have used Heikin Ashi. Do these use similar calculations?
Yeah, although I often tout the benefits of naked charts, I’ve seen many pro traders use indicators to their advantage. After all, they are making a living from trading, so it must be working. I say, do whatever works for you.
Without indicators trading means walking in the wilderness without a map or knowing no location.
Indicators are a lot like the IKEA of the chart world. Opening up a box from IKEA and then sitting on the bits of wood on the floor is not as useful as following the instructions and building the chair. The naked charts have all of the information you need but sometimes an indicator can be helpful in putting the pieces together to form a picture which you can use to make informed decisions. Knowing how the indicators you are using actually work, their benefits and limitations and what they are actually showing you is very important. Can you trade without them? Yes of course you can. Can you trade with them? Yes of course you can. Whatever makes you more successful.
Right. If I argue with you about X strategy vs Y strategy, what purpose does that really serve? It’s just me defending my ego against your ego. Even if I’m right and I prove my point, how does that help me become profitable?? You lose the argument but your profit % doubles mine, who’s really right?
All of us are alone in a room trying to make some money. Arguing over whose strategy is better really doesn’t help. Sharing and explaining helps, but arguing over who’s right and who’s wrong is just something to pass the time.
I hope I don’t fall into that trap…
I can appreciate what you’re saying, but you still have the candles, and the patterns they make, which give you lots of information.
Forex trading without the help of indicators is like walking towards the destination of failure. Moving average, Bollinger bands, RSI and stokistics are commonly used indicators.
I prefer trading by following RSI, Moving average, Stokistics and Bollinger bands indicators.
Patterns or structure has the advantage of one candlestick. An indicator will complete at the candle close but something like support will show up somewhere in the bar.
For technical analysis, indicators are the weapon without which traders can’t forecast the market.


