When it breakouts from the Trinity thats when the “Magic” happens and the market gives us a ridiculous profit opportunity for Trend Trades. Want a preview on how incredible this tool is? A Sneak Peek of one of the 25 Days next month you will be given?
You just made my day. Since I started reading 2 weeks ago I have talked to my girlfriend about this thread everyday; she keeps asking me for a christmas list, but honestly I just want to learn to be a successful trader, and the gifts of knowledge are here and yet to come.
I shorted EUR/USD at 1.3820 and took profit at 1.3800 for a 20 pip profit.
I should of just moved my stop down and tried to rid this thing down but for a first live trade I didn’t want to be greedy and just took my 20 pip profit for the day.
It feels good to see that I had the trade down correct.
It look like it would of been a better setup on the GBP/USD tho.
I don’t remember ICTs sunday gap trading in full but being that EU opened above Friday’s close we could expect a small move up before heading further down (whiplash or something like that) into higher TF long OTE’s (1hr/4hr) which could send us into the daily TF short OTEs. If you look at EU on the daily, price had just touched the 61.8% and will probably aim for the 70.2 or 78.6. That move downward to the 1hr/4hr OTEs would also put us in the TT buy zone.
Just what I think may happen, remember I’m still learning too
For bullish environments you can buy the SMT positive or Bullish Divergence inside and or at the Friday closing range upon gap filling.
Take profits at 20 pips and set remaining portion to breakeven and look for London continuation into New York session.
The reason I thought this looked good…
1HR & 4HR TF’s market flow is up
SMT Divergence on 5min TF when entry was available.
Confluence of Friday’s and Today’s CPP’s.
If you do look at the trade depending where you got in it could of been 20 pips profit, but very close…
What I like to do with these scalps when I have 15 pips profit is to move my stop to breakeven and then once we hit 20 pips I will take full profit out. Not sure if this is correct or not but makes me feel a lot better about the trade…
Just wanted to ask if I am applying the basic concepts correctly here. Sunday gap up on cable.
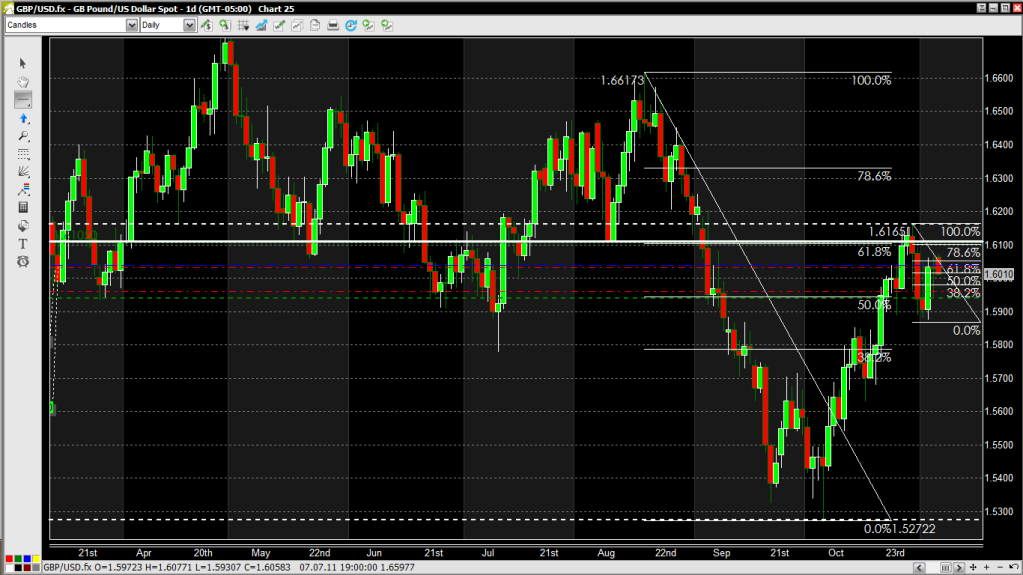
Here is my daily chart. I’ve put a month TT on it and monthly pivots. Price opened in sell zone and on MR1
Also, on the most recent swing down the 61.8 fib is almost right on top of the monthly MR1.
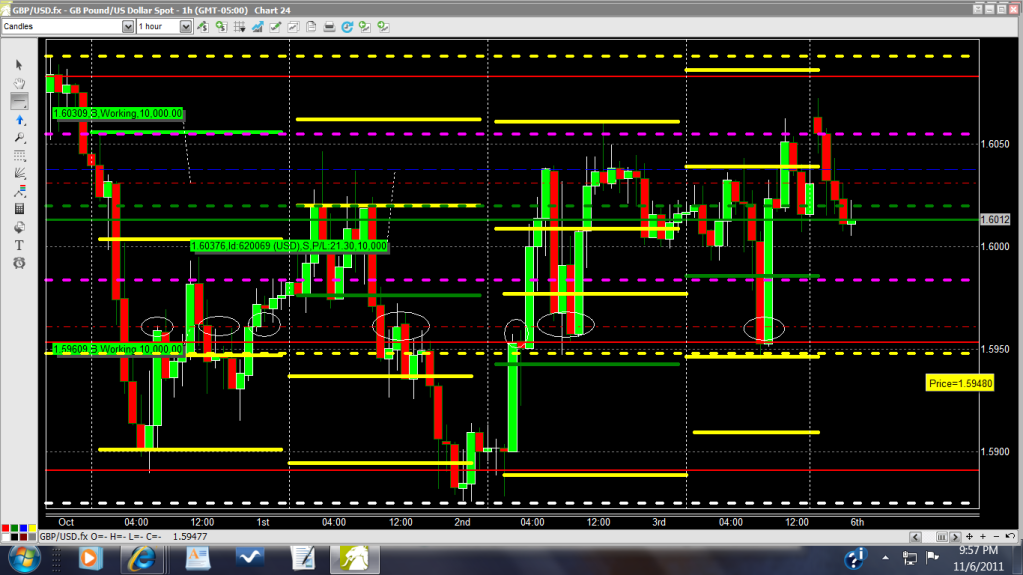
On my hour chart I have the weekly TT - and price opened just out of “no man’s land” in the sell area. Above this area at around 1.6110 there is a convergence of fibs Longer term 61 and a shorter term 78 fibs and an S/R area. (I’ll be looking for price to revisit that area and short again) Also price moved up to Thurs/Fridays’ MR2 & R1 and took out Friday’s High.
For my TP I’ve marked an area with circles that has acted as S/R over the past week.
Thanks
Jack
A question about Asian range highs and lows: Are people calculating the Asian range as the highs and lows set in the Kill Zone (up to 2am GMT), until the Nikkei close (6am GMT), or until the end of the business day (8am GMT)?