I just found this topic thanks to NB and the information here is great. Will continue to watch as the thread progresses. I realy enjoy the non-indicator trading. The further along I get with my trading the more and more I remove indicators. I am down to only pivots session high/low indicators now (instead of drawing manually). Great Stuff!
ITC…your profile says you are in Maryland. I’ve seen in the thread where you state that you trade London. Do you get up for that time or do you have your limit orders ready and waiting to trigger only during London time?
I’m really looking forward to trading this week! and the real special part is that I don’t care if I win or lose. got all my tools ready, levels plotted, now just going to sit an wait for something to catch my attention. don’t got much on my plate yet, waiting for price to retest 1.6000, then we’ll see what’s up with those bulls.
targeting a modest 50pips for this week, and my account leverage is set at 10:1 so there’s not much trouble I can get in to even if I make some crappy calls. i’m hoping all the stuff on this thread is making sense to others too!
I understand all the lessons and the way each tool is used, the only hard time I’m having with this system is how all this is put together. My brain likes to think logically and I can’t seem to create an order for all the analysis. Is there some sort of checklist perhaps or a more concrete plan to follow? I know this is discretionary trading but I’m getting some information overload now and having a hard time placing trades.
Hey ICT, been follwing your threads from the start and really love your work here!
Today ive been looking at the audusd pairing, this was my thought process today. Didnt take the trade, just observing.
Daily and 1 hour chart fractals show market flow is up. I remember you saying somewhere that you want to have 2 out of the
daily, 4 hour, 1 hour chart flowing in your direction?
15 min chart with the daily pivots plotted shows price is in the buy zone, the S1 mid point and 62% retracement, optimal entry area alignment. Since watching that area for the last few hours, price has bounced off quite nicely!
Just wanted to share. After watching ICT’s last video, I realized that I was forcing the tools into the market so that it would fit the way I wanted it to.
Today, I took a trade on the Cable. I knew market flow was down and price was in the sell zone of the pivots so I was looking for a sell. At first, I put a fib on from the low to the high of the previous day. The market retraced exactly in between the 62% and 79% levels before falling sharply down. I missed this move but noticed that the market was starting to retrace again so I put on the fib again and entered again between the 62% and 79% levels. Market slid down sharply again after that. Using ICT’s projection technique, I set my profit target and it was right on the money. Banked 70 pips!
This just proves what ICT was saying all this time. Don’t force the market to bend to your will. We won’t find setups at will. We should let it come to us.
Thanks ICT. Finally beginning to understand the power of these tools.
Wasn’t up in time for the prefect entry. Was short GU at 1.6082; went long GU 1.60395 because confluence previous day low (2 days back), pivot point, 50% fib retrace of the last daily long swing, and this was 4hr support retest. Took full profit 61022. Set take profit by placing the 50% fib at the 15m consolidation and drop, TP was the 100% fib.
Sorry ICT, I don’t like visiting the forums too much while I’m in a trade simply because I don’t want to see anything that could influence my decision, other than my charts, and potentially cause to me mess up. The first short @ 1.61319 I exited at 1.60626, (the 1.272 extension level) the second trade @ 1.60999 I took partial profits at +30 and was stopped out at break even.
Shorted again 1.61096 today. And, I just saw your video where you said we could possibly see higher prices. That’s why I like to avoid forums while trading lol. The trade hasn’t gone very far and may possibly close out at BE though. I think if it was going anywhere it would have moved a bit by now but I will let it run and at worst I gain something like half a pip…
I just wanted to comment on something you’ve said over the past couple of videos. You note how people try to sometimes make tools fit what they want to see, and also how you feel some people may be taking what they’re learning with you and adding to what they consider a successful trading method even though it probably isn’t. I am guilty of both of these things to one degree or another, and always catch myself doing this and try to refrain from it. You are a very astute trader to be able to recognize this in your students and to remind them of it. It keeps it fresh in my mind, and I think they’re the most important lessons you teach.
Bounce of previous week’s R2 (turning into support) and the low of London session Friday 04/02/11.
Starting to grasp the concept behind your videos - Thank you ICT.
A sharpshooter aims at the 1.6020/45 support channel IF USDX resistance holds and news fog doesn’t obscure the view.
There have been three “kills” since Feb 4th. :-).
The 1.6020 level (took the whole number) has acted as support several times now. First it was resistance during the month of January until it was broken and then became support during the weeks of February. I think this level is especially significant because price was never allowed to retest the 1.6000 figure and is always blocked at around 1.6020. This is, as ICT has mentioned, purposely done by the market makers as they don’t want the bears to start pulling the price down again (which would be the case should price hit the 1.6000 level again).
This is, in my opinion, why price bounced off this level so drastically on Feb 9.
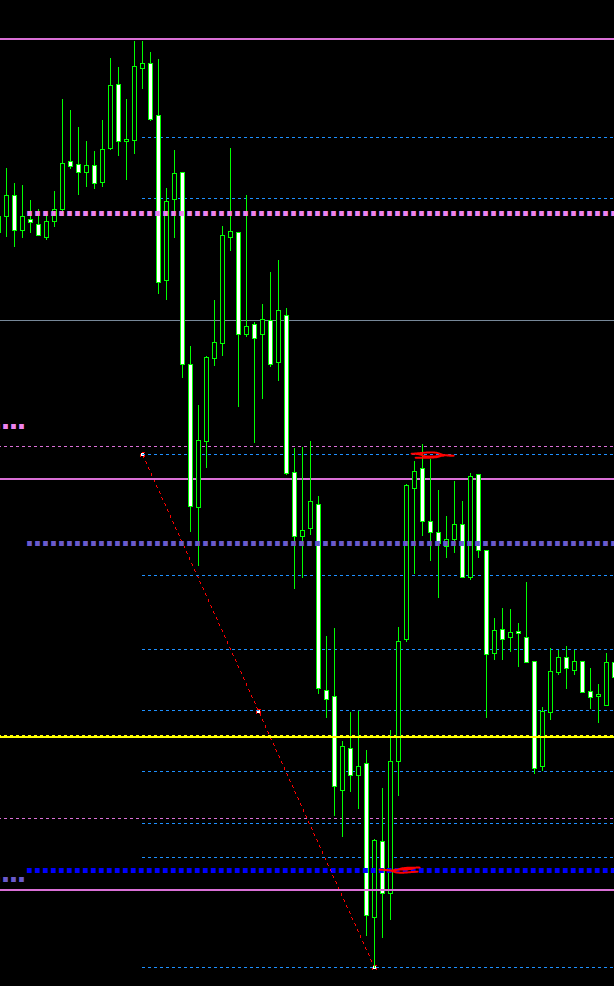
GU went down with a great setup which I missed most of. The long was off the bottom. At the bottom the blue doted line is the pivot; the pink line is the previous day low and a retest of the support on 4hr. The pink dotted line is a 50% fib based on the daily (drawn up, so this is a pullback from a long momentum move). The yellow line and yellow dotted line is a monthly fib and monthly s&r line.
So at the level of entry long (red mark), there was confluence of several resistance points. I traded the pivot point up.
TP was set on 15m chart, I placed the 50% extension on the previous consolidation before the final drop and made TP 100%. That also coincided with another S&R zone on the daily. Trade was 60 pips. I haven’t mastered proper money management yet and I am still working on that.