This was a short move on the GU not long after that last trade.
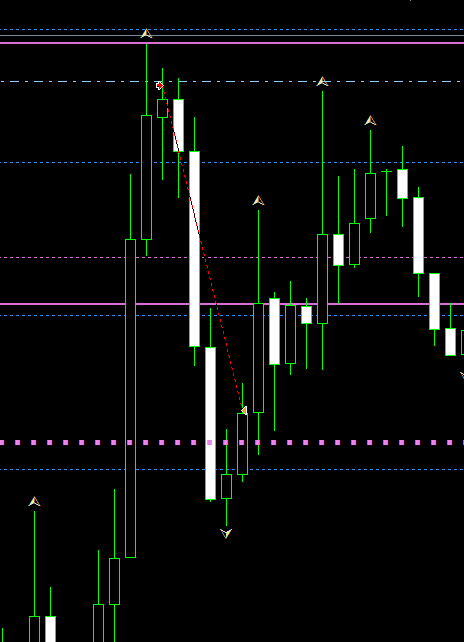
The setup here was based on fib drawn on 4hr previous day high and the last low. Confluence was the 62-79% fib PA went to right under 72%. Entry on way down near that blue dashed line which was previous 4hr support, now it was being retested here on the way up. Also time of trade was about 16:30 which is UK close, knowing that price has tendency to return to lower range and now break strong s/r after London, I was okay with the trade (not as good as the last setup confluence). Was also above the daily pivot trading DOWN to it.
Exit was manual based on 15m candle formation as shown below. In hindsight I should have kept the trade on which woulda been one great overall short given today’s events.
Exited when PA went below daily pivot and turned north, next 15m candle was another higher candle so I bailed. Again my issue is to trust my trades and let them run, something I have to work on.
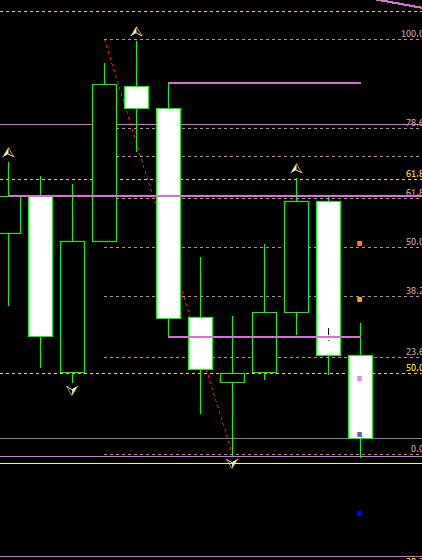
This setup occurred after the last trade. Price was bouncing up to 2 fib confluence of the 4hr 78.6 retrace and a daily 38.2 retrace. Also present was the pink line, a daily s/r zone. Would you take this type of setup for a short given that you are at midS1, 4hr/daily trend is short. Your fibs and daily s/r zone is right here. If so, how long would you keep an entry short before declaring it invalid?
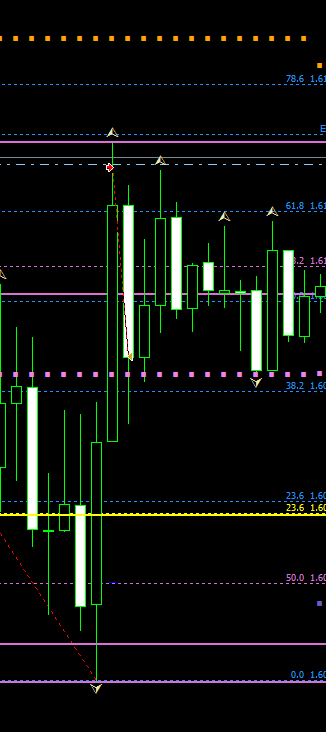
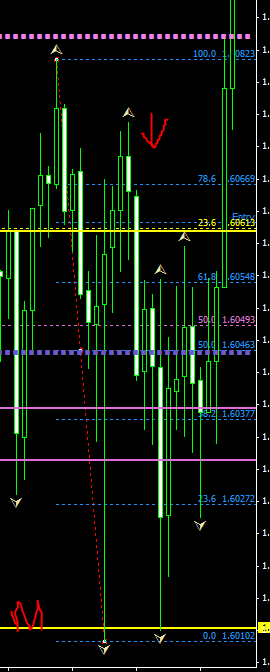
This setup occurred today (1hr chart). Price broke down and went to test a monthly s/r (yellow line). After touching line it pulled back and exceeded the 78.6 %. At the entry level on the way down there is another monthly s/r line, a 23.6 monthly fib level a daily level which is on top of the monthly level.
I didn’t enter short here for a few reasons. 1) Price is below the daily pivot point so in the “buy” zone; 2) US unemployment claims came out 15 mins prior, so did not want to engage in a news trade; 3) The HUGE wick on the candle that first touched monthly suggested that lower prices were not acceptable by the market.
Do you use the buy/sell zone as a hard rule or can it be cautiously ignored if you have several supporting factors to indicate a proper trade is can occur?
If the daily/4hr or 4h/1hr are showing short bias, do you look for long setups at all? I’m asking how would you determine when it was time to start looking for a long push.
I ask because it did not seem like any longs were available, at least using the fib retrace rule as part of the confirmation checklist.
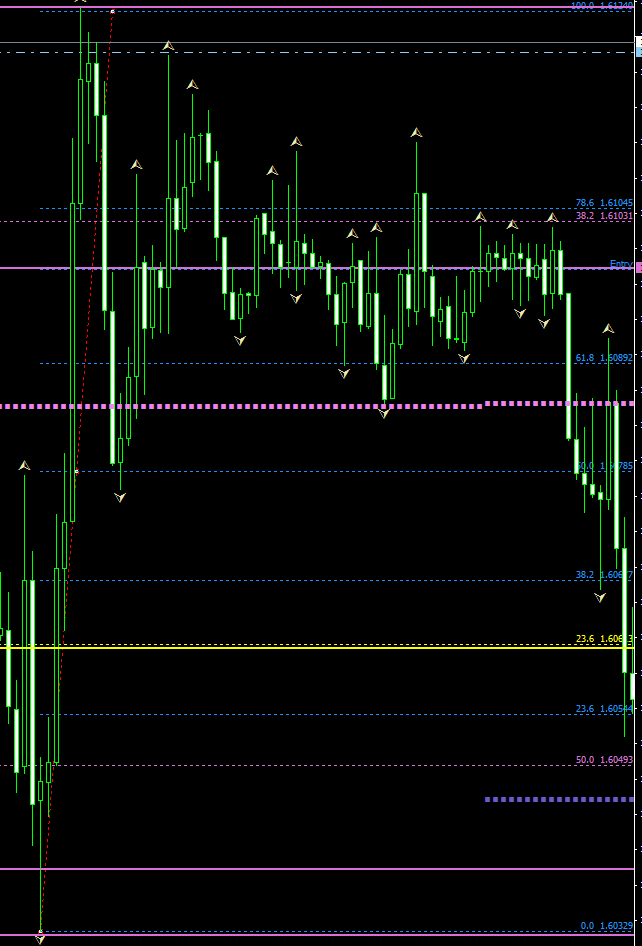
Closed out my scalp a few minutes ago. Entry was at 1.61274, exited at 100% of the swing (1.60914) Price was above the ADR, a little later than what ICT said but still [I]near[/I] the same time. Entered at the .618 retracement :p.
I do look for trades counter Market Flow bias… but it must be in agreement with longer term Support and or Resistance to warrant a valid setup… COT comes to mind here as well.
For the trades that do not have the Longer Term bias against it… the 4hour Market Flow confluence with Daily or 1hour… will serve you well and hunting trades in that direction with Pivot Zone bias as additional filter… your trades will be reduced in number… the payout and consistency will however, increase exponentially.
GLGT
BTW I’ll feature your trade questions above in the next ICT Pro Traders Feedback section… no voice currently lol… sorry.
The daily high/low fib is about to reach the 62% retracement, 1.60500, the S1 mid point and is overbought on the 1H. Good time to buy, or am I out to lunch?
edit: I also noticed that on the daily chart that the 1.60500ish area has been resistance quite a few times. I’m thinking it’s going to turn support. I’m long @ 1.60600.
Hey ICT,
Thanks for providing us with a rough checklist, just demo-ing now and I feel much more confident analyzing prices now that I have my order! Haha. Will there be more instructional videos released? I noticed on your blog you have quite a lot of content to go through still! I’m looking forward to it!
I was also wondering if I could have your permission downloading your videos from YouTube onto my iPhone? That way I can watch it over and over again while I have free time.
LS1, I saw and took that trade too, except I got 1.6055 just before London open. Optimal trade entry was 1.6050 but I missed it. Price traded down to M2 and bounced, so I thought a long entry would be a good bet. Looked on the 4H chart and noticed some stops likely got taken out below 1.6030 and then price shot up after the BOE rate announcement. Got stop at 1.6020, targeting today’s R1 level at ~1.6127. Partial at 1.6100.
Going to sleep, gonna check this out in the mornin
Just continuing on with what ICT was saying in regards to taking trades that are counter market flow. I think right now there may be an opportunity to take a trade that is going against flow.
There is significant support around the 1.6030 area as can be seen in the hourly chart below. Price has bounced off that area a number of times. Does that satisfy your requirement that there must be a longer term support/resistance to take counter market flow trades?
Is anybody else just sitting it out at the moment?
Maybe it’s just me. After quite a successful run, I’ve found myself getting back into old habits of overtrading/looking for trading opportinities that aren’t there - with predictable consequences. So patience is the name of the game for me right now.
Apart from the fact that it’s Friday, it all looks a bit uncertain. Particularly market flow on the 4hr (0900 GMT). Euro is pressing heavily on support right now and I can just see this being the day that Cable crashes through support. On the other hand, market flow could quickly switch to long. I don’t know… that’s why I’m sitting it out.
Yes I’m sitting out. I didn’t/don’t really see a good solid area of multiple S or R confluence yesterday or today. In spite of my interpretation of the COT which is bearish oriented, it just seems to be floundering. There was a couple of really good areas earlier this week, of which I caught a little of, but missed a big chunk of, but I don’t feel a need to force something that just isn’t quite “there” for me, so I’ll wait for the time when it is, which looks like will be next week now.
While we are all just sitting on our hands (yes, me included), maybe somebody could help me find a way out of my COT confusion How can I use it to confirm the trade? Last week’s COT suggested Commercials were once again increasing their short position, and are now at an extreme when considering two year’s worth of data. Any confirmation here according to ICT’s teachings? Maybe potential for the market to reverse i.e. price to drop through support?
The Futures market data suggests that there is still a premium on the market due to backwardation (this suggests higher prices, right?) and Open Interest has been on the rise for a while which I believe indicates a continuation of the current direction (not part of ICT’s teachings thus far, but something gleaned from Steve Nison).
Yeah I know how you feel. It’s so hard to tell whether you are using the tools to read the market or if you’re using the tools to see what you want of the market.
(Pink lines drawn off daily; yellow drawn off weekly).
Daily candle setup. What I see in this zoomed area is price came up to form a new intermediate high. This high was between the weekly 68-79 (right under 722% actually) with a long term bias short. EU could have been shorted based on weekly at that point.
EU fell down to a weekly support line retest and bounced up. Price action stopped at a previous daily support level (pink line). At this point there was confluence of factors: 1) weekly long term bias short (making lower intermediate highs); 2) traded up to prior resistance level which was still fresh; 3) price stopped on the daily fib 62-79% level; 4) price stopped at the weekly 61.8 retrace level; 5) not shown in picture is the Daily R2 which lies between the 2 61.8 listed on the chart.
I think these confluences strongly suggested a great daily short EU setup. 20/20 it was a good setup, but I wanted to recreate the analysis anyways.
From top down analysis: 1) USDx was at support level and likely to move higher, giving strength to USD and support EU move down; 2) did not check interest rate overlay; 3) futures lead month closed higher than 2nd month; still unsure how this works; 4) previous market sentiment ticked down to suggest bearish EU; 5) COT shows commercials net short so they are looking for price increase, this goes against trade.
All in all, the factors greatly in favor of moving short outweighed the factors to go long. In the end price went down to retest that monthly support and bounced off it.


 How can I use it to confirm the trade? Last week’s COT suggested Commercials were once again increasing their short position, and are now at an extreme when considering two year’s worth of data. Any confirmation here according to ICT’s teachings? Maybe potential for the market to reverse i.e. price to drop through support?