ICT mentioned that prior asian session highs / lows can become significant support / resistance levels in the future.
Ok, but you would draw a line there anyway, even if you didnt know it was the asian range. If you didnt know what session
that was, and you saw a line of support/resistance, then you would note it.
Haha wow I just watched that now, you called it to the t!  Nice! If only I had been able to watch this yesterday!
Just one question though please ICT  Why would you feel that price would all of a sudden reverse after touching the high of the day today? Was yesterday’s price action enough to convince street money traders that the price action is now bullish, and so they would’ve been pouncing on that break of yesterday’s high, only to find price pulling back downwards at a ridiculous rate?
If I was trading last night I bet I would’ve went short at 3150 and been stopped out at 3180… Just being honest
UPDATE: Bullish divergence started at 10am GMT yesterday. I had 18:00 GMT in the original post.
Just speculating here…
There is bullish divergence on the 1 hour chart from 10:00 GMT yesterday through current prices. This is indicating to me accumulation is occurring for a move higher.
Price on the GU is above the TT and at the moment, is respecting last weeks high as support. Last nights Asian range was sitting right on top of last weeks high.
EU on the other hand is in the buy zone of the TT.
One observation I’ve had looking back over 4 hour charts with the TT…price usually will only break out one way or the other. Once it breaks out of the TT, it may retrace into the TT, but usually won’t go beyond the sell zone low or the buy zone high.
Also, today apprears to be shaping up as a Z day on the GU. I think during the LC, we’ll see the price move higher. Or we might range and a setup for a bullish day tomorrow to be setting up. If this is setting up for a bullish day tomorrow, we will likely see a retail trap set to encourage short positions to be taken through Asia and up till 7am GMT tomorrow.
But my speculation is that by tomorrow NYO…price on the GU will be at or above 1.5813 (161 extension of this weeks TT). If this is a big move, it could go up to 1.6050 (261 extension of this weeks TT)
Ok wait I think I just saw the answer to my question - that video is pure GOLD!
Actually I think that is probably the most eye-opening video I have watched so far, that rant about how badly the big guys want us OUT!
Thanks a million ICT, I cannot say it enough
February 2012, so make a cuppa and sit comfortable, will take a while… :59:
I agree with this, but I am sure Wally was trying to convey more than that it just may have not come out.
This asian range stuff has to be taken into context with everything else. Yes it is the key to the day unfolding and ICTs latest videos show this, but lets not get so caught up in it right now because if it doesnt make sense, and its not like its crystal clear to me, it will undoubtedly clarify itself with ICTs further releases.
Honestly some of you would be better just disregarding it because it is just messing things up. Its not like everything else presented here wont apply, but its an advanced dance step and those things arent always easy to get right away; I am a terrible dancer.
The asian range is the suck in, its like the casino gets to review the day and see where the money is and position itself to take that money. Look at the templates and you see that a fake breakout is often the first thing that happens because thats how they initiate the day and get the orders in place so they can take the other side.
ICT said he rarely trades the asian session and it seems like people are taking this asian session thing as where to initiate their trades. The asian session is where you personally get to view the foot tracks of the banks for when the day heats up. This is why I think the LO stuff will help clarify this. Its the LO and NYO that you really want to get into the high probability trades because the asian session will have told you why. You open your charts prior to the LO you go ‘oh crap the asian range is sucking people short, look it broke down’ you view your template and voila that nice break out traded up and back into a nice LO ote where you want to trade.
And no it will not look that pretty everyday and you catn superimpose the templates and have them fit exactly, but hey maybe those are the days you shouldnt trade, if you cant find other confluences for positions. There seems to be a want to trade everyday, but if you find yourself trying sooo hard to find a setup then maybe back off.
It has been shown many times throughout this thread that the templates and confluences will line up almost to a tee, and this is forsure once or twice a week. As ICT says who wouldnt be happy bagging 90-100 pips twice a week; I mean some guys goals are 30-60. and if 25 pips is 2% thats upto 4-8% on the twice a week pip runs.
I understand some guys are kinda like well this asian range did this on wednesday and went up but it didnt do that on thursday and still went up, haha only if it was that perfect. If you get up for LO and/or NYO you look at asian session in the context of everything else we have learned see if the banks drove a tank through your front yard and set up a trade because wow it is exactly my buy day template. Maybe the next day you look for the tank tracks, but the banks decided to use a helicopter maybe just go back to sleep or study ICTs methods on how to spot helicopters until you get it.
Sometimes we try a little too hard.
I see S/L orders collecting like candy canes on the tree and my 5yr old ready to grab them when I’m in the kitchen…
If I was a big bad bank boy, I would like to lower the fiber, blow out all the final resting stops below januari lows before moving higher with my cable sister. Looking at the daily charts you can clearly see that the cable has more bullish pressure than the fiber. The fiber is hesitating, the BBBB’s want a X-mas bonus (and it is waiting below januari’s lows). See the hughes divergency between cable and fiber? They are playing with the market…
take care

Don’t lose sight of your territory folks… you have to survey the land for potential killing grounds… the new stuff just adds accuracy to what you already should be doing daily. :57:
I don’t understand the OTE in your chart. I’m trying to replicate the chart in my MT4. I’m on the EU 15M chart. squished it down to get this view. Its a little hard to figure out the fibs you have drawn. I see 2. The more recent one, I think is a fib from the bottom of the LC KZ yesterday, with the 50% resting on the high of yesterday. That puts the 100% extension at the high of today. The second fib is from the swing high established in the range on the left side of the chart to the most recent low. On my chart, that is putting the 78% retracement level at 1.3171. It looks to me you have the OTE marker in the space between the 78 and 100 levels of the 2 fibs. Not the 67 to 78 which we would call the OTE.
Are you suggesting we might have entered short at the 78% retracement level of the outer fib today?
But I don’t understand the OTE comment.
ICT,
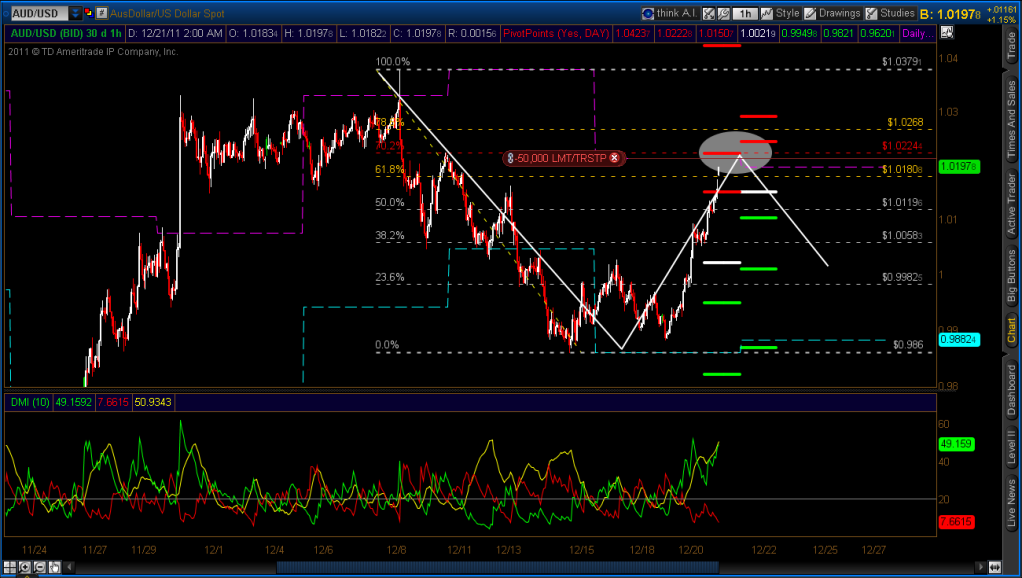
Im short aussie from 1.02 I did what you said, stalked price action. Thank you.
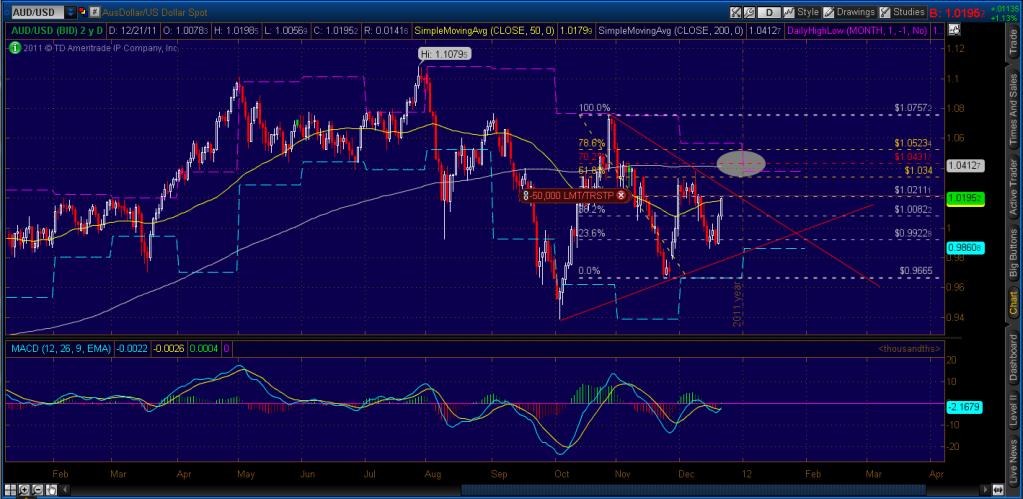
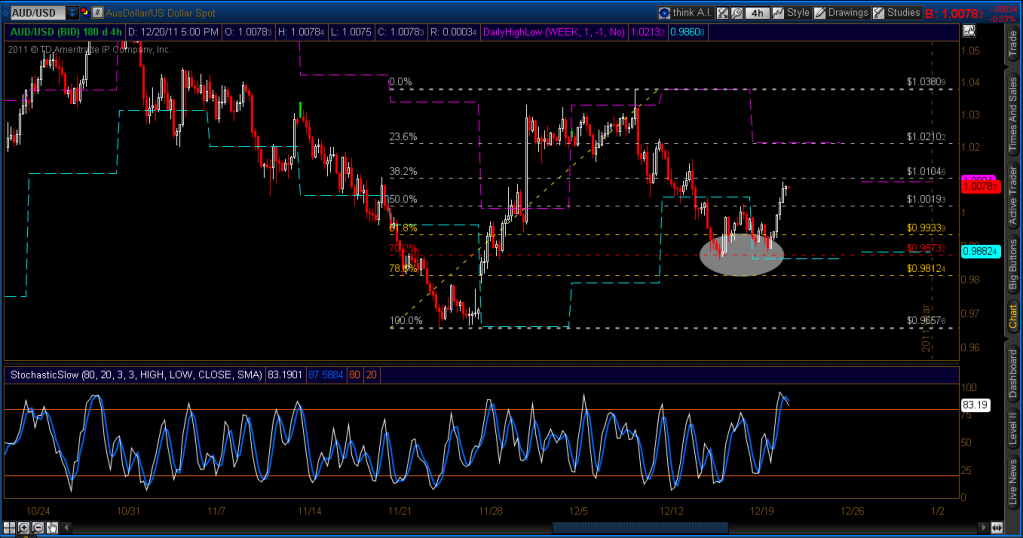
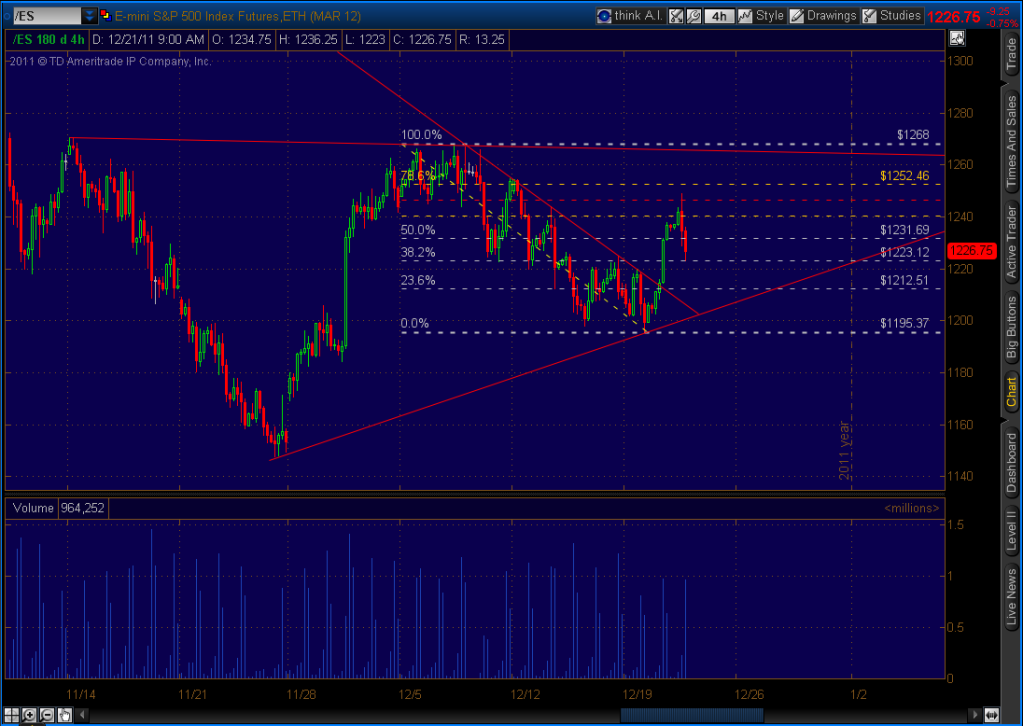
First of all, the most recent monster rally was a bounce off OTE/double bottom. On the daily chart we were approaching the 50% fib lvel, a weekly high on the 4hr chart, and OTE on the 1hr chart. On top of that I was looking at S&P 500 futures which was approaching OTE on the 4hr chart. And on top of that all of my indicators were showing overbought conditions, of course. In addition, DMI was showing extreme momentum on the verge of peaking. Oh and also what were the chances of price piercing R2 two days in a row…slim. Check out these links to see the level I was eying (1.0210) on the way up.
EMini s&p 500 futures now…
Hi Ict,
I was wondering how I could participate in your live webinars like you have on livestream. I have some questions, because I haven’t been able to get through the whole thread. Also I am still trying to catch up with the videos. I am excited for this forexmas stuff, but am a little stressed I might not catch up. This is great stuff though. Thanks!
My personal suggestion is slow down and go through the thread like everyone else did. Getting in a livestream chat won’t speed up your learning process anymore if you don’t understand what we are talking about/looking at. Its always a pain in the beginning but just gotta rough it out :57:
Hey guys, i just finished my first real money trade, and its the last trade for the year… my heart went crazy but everything worked out. I think its a typical London Close counter trade. I went long on the cable and the fiber, with both 1% Risk, so its 2% overall.
Fiber

…and the Cable

I want to say thank you again, of course to ICT (great vids about the asian range, cant wait to see the rest) but to the others too. Merry christmas and a good start into 2012!
Hey chaps,
a quick LC scalp on Fiber I want to share:

Reasons: Fiber went below the ADR, retraced to 20% of the Daily Range, then gave an OTE where I entered (1.3034). Stop was 10 pips below the Fib or 20 pips total, Target the GMT Central Pivot. A Perfect LC trade from the books!
The only problem, this was on the demo account again, entered on Live Acc. simultaneously, but got scared from minor pull back and exited for about 8 pips profit…
Lesson to Learn: Have to trust the bloody tools given by Michael, they are simply brilliant! and this is not the first time this happened, simply my mind completely changes when real money are on the line… more and more practice should cure that I hope…
Travie McCoy: Billionaire ft. Bruno Mars [OFFICIAL VIDEO] - YouTube
GLGT! :41:
I think this is what ICT is showing in higher resolution and also took some notes on what I saw.
Click to make it bigger…

Brilliantly Said Fury, 100% agree with you… as ICT says: nothing is black or white.
:41: