How are you seeing SMT confirmation of a long with the USDX/EUR on the daily? All I see is lower highs on the USDX and higher lows on the Fiber…
Nice! I pocketed 30 pips myself before my trailing SL got hit. Made it too tight. 
About 42 minutes into the Short Term Trading video, Michael aka ICT admits to his mistakes.
That may seem like a triviality, however it is not.
It shows humbleness of a great teacher, but even more importantly it shows the willingness to admit to ones own failures and at the same time, therefore, it is a great lesson for all of us.
Big Kudos to you, Michael !
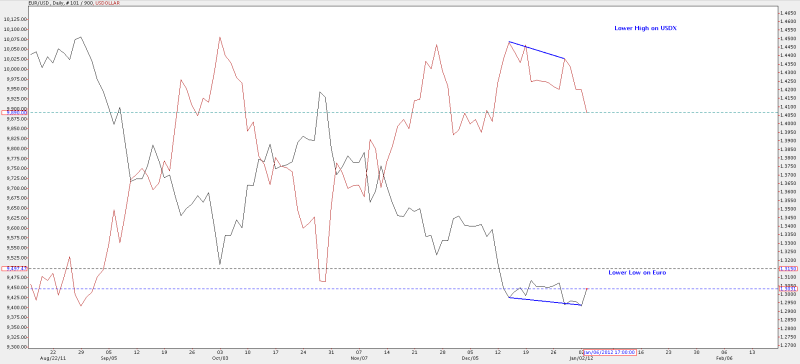
Well all I can say is the fiber/EURX has been making lower lows while the Cable and Oz (I’ve been using this but now ICT pointed out the usdx, I might dump it) where not making lower lows and the USDX wasn’t making a new high. That’s what I see anyway.
Wally
It’s an inverse correlation, meaning if the USDX makes a higher high, the Euro should make a lower low. When that doesn’t happen, for example, the USDX makes a lower high, and the Euro makes a lower low, a divergence is occurring between the US Dollar and the Euro.
See pic for example. The lower low created by the Euro isn’t matched by a higher high on the USDX.
EUR/USD maybe a sell?!
- Now in London close kill zone
- For-filled average daily range
- SMT divergence against cable on 5 min chart.
Could that be it for the day, or do they want to bang the stops above 1.3083 to finish off the first trading day of the year! Watch this space…
- Also gunned the london high stops above 1.3059
The USDX made a higher high on my chart. Am I looking at the wrong thing?
This is from a Forex Ltd demo account feed.

Another SMT divergence against GBP/USD
In short at 1.3060, stop 1.3080.
Here goes…
I understand the concept, I just didn’t see it happening between the euro and usdx this morning. Didn’t check the cable/usdx…
Just curious of your thought process on your entry. I got short at 1.3048 in the OTE…how/why did you wait for it to get up to 1.3060? Obviously that’s a better fill than I got, but were u just waiting for SMT divergence or something? Just curious…
Because I didn’t have the balls to sell the initial spike higher up to 1.3067. I waited for the pullback to the OTE entry between 61.8-79% on the 5 mins chart
[QUOTE=InnerCircleTrader;306628]Folks, if you haven’t fully grasped the concepts and feel like the rest of us are going to leave you in the dust… STOP.
QUOTE]
Thanks for this Michael, I am a newbie as I posted before. I feel I canot catch up with this thread, I’ve been reading through it from both ends and with all the new material being posted I feel I will never catch up…until now.
I have traded a few months last year both live and on demo, I made some money on my live account only to lose it a few days later! I now have 2/3rds of my initial capital, but I am now going to put in the time to work through the thread and follow the material in real time over the next year on demo only. I have come to this conclusion because I cannot follow both the early part of my learning and the latter part that I do not have the basics in place. I am not going to try to play catch up but actually learn how to trade Michael’s way.
I hope this post helps all the other newbies that seem to have joined in lately, I will remain in the background studying, but will also join in posts as I can to both help other newbies if possible and also to ask questions as I learn.
I wish everybody a profitable new year and look forward to learning along the way.
Regards
John
You’ve got to compare apples to apples: change to a linechart (on close) instead of candles. You’re drawing the lines over the highs now, and compare them against closes (I assume) on the other chart.
The forex ltd. linechart does show a HH nonetheless.
There are several sources for the dollar index. I think forex ltd. shows their price (!!!) to trade something that resembles the dollar index. Both the cash index as well as the futures show a LH however.
Futures: Click here
Cash index: Click here
Not sure what ICT thinks about this; I think it’s best to use the cash index to compare against EURUSD and GBPUSD.
Interestingly, it appears to me that divergences between the futures and the cash index can also be used for crystal ball purposes…
EDIT: Candlecharts will show lows and highs. Linecharts typically show closes. I think the idea is to compare highs and lows, so candlecharts are the ones to use.
I also noticed different prices on forex ltd USDX compared to other sources… I am puzzled about it:)
There are sources in the internet to get the USDX charts from, but I just find it more convenient (for lack of a better word) to have them all in mt4…
Since USDX is calculated with some formula against other currencies, shouldn’t it be possible to create an indicator that draws the USDX in any MT4, no matter if the broker supports USDX or not? By using the same formula, using the price feed provided by the broker?
Does something like this exist? someone smarter than me wanna give it a try?
It exists. I have seen an MT4 indicator somewhere, can’t remember where.
I’d be surprised if that indicator would show exactly the same prices as the USDX on forex ltd
EDIT: google “dollar index mt4 indicator”. You’ll see factories full of them… :48:
maybe its smarter to google “why isn’t forex ltd showing the correct USDX price” but I definitely appreciate your reply!
lol !
The answer is: if they would, they wouldn’t earn any money on offering that instrument, in which case they wouldn’t offer it… :60:
Hello everyone,
I wanted to share my first cable trade this year. This was the first time i could manage to get up early in the morning and have a look at LO.
My Reasons:
- MF up on H4 and H1
- price opened near CPP which was also yesterdays CPP and near big number 1.5500, CPP was tested and held
as S - price shot through R1 and a S+R level only 3 pips away + inst. level 1.5550 around, fell back down to R1
which now acted as S - then price shot up to R2 where i had another S+R level + inst. level 1.5580 around, price retraced and
gave me an OTE during LO - at the same time there was a bullish SMT divergence on M5
Altogether cable was very bullish this morning, so i went long @ 1.5554. SL was 30 pips initially, i moved it up to BE+1 after 1st TP. My 1st TP was @ 1.5584, i scaled out 0,03 lot (+ 30 pips); 2nd TP was @ 1.5600, i scaled out 0,02 lot (+ 46 pips). At that time i had a trailing SL of 30 pips which was hit @ 1.5592, so that was the 3rd “TP” (0,03 lot / + 38 pips).
I had planned to hold the trade until LC or at least up to 1.5635 because of another S+R level and Fib extension, but during NY the moves were to large for my SL (and 30 pips is definitely my max).
After that i decided to stay out of the market for the rest of the day because at that time R3 seemed to hold as R and i wasn’t really sure if price could break that level today…well, during the LC kill zone it obviously did.
I try to attach a chart.
And now i wish all of you a happy new year and happy new trading 

INO.com Markets - Chart for U.S $ INDEX
The intraday price action still shows a higher high using a bar chart and its the same as Forex Ltd. Are we supposed to be using line charts? I assumed the intraday action was important.