What Every New & Or Aspiring Forex Trader... Still Wants To Know

Thanks Wally.

I don’t think it’s a function of the fractal indicator being quirky, rather different definitions of a fractal. The fractal indicator uses Larry Williams definition which, for a fractal high, requires 2 candles on each side to have a high lower than the fractal high. A 5 candle formation. Ict does talk about it as a 3 candle formation and requires 1 candle on each side to be lower.

Not so much an I reliability issue compared to another apples/orange thing.

What you highlighted is indeed a sth using 3 candle formations, but not one for 5 candle.

Personally, I don’t like the look of the market there to use that 3 candle formation as a sth. It doesn’t look right to me as it doesnt look to be a swing high. But just a matter of personal taste.

Just wanted to point out to others that it’s not a reliability thing, but a different definition.

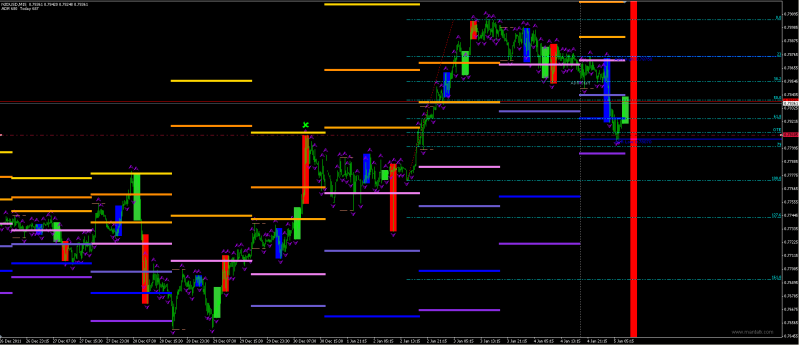
Live example of homework requested by Michael.

Kiwi
Market flow and structure are both bullish
Fib pulled from Jan 2nd to high made on Jan 3rd
OTE long at the .7810 level in sync with market flow.
Confluence with todays MS3, ADR, and well into the buy zone.
Note how the very clean high on made on Dec 30th is right in the middle of the OTE.

Anyways, half profit would already be off at 20 pips, rest would be left to ride. For disclosures sake, I didn’t take the trade, although that’s how my chart was marked as of my analysis before going to bed last night.

Sorry for the chart size, just wanted to show the left to right, uptrend aspect.

Edited to add that the Aussie was set up exactly the same, however if you entered directly in the middle of the 62% and 79% retracement on a limit, your stop of 20 pips would have been hit. However, if you zoomed in you can see a 5 min SMT divergence which would have caught you the absolute low on both pairs.

Second Edit, stopped out BE +1

I think Michael uses the 5 candle formation aswell. He talks about that in one of the latest videos…power of three perhaps but i’m not sure.

I haven’t watched that one yet. On the list of things to do. I know he has talked about 3 versus 5 candle formations for fractals in PTC videos. I plan on going back and rewatching the PTC videos again, taking notes this time, but also bringing the charts up on my screen as I watch the videos and put some of the new insights on to see if I can see more (TT, prev friday asian session range, monday asian session range, etc).

But if ICT is using the 5 candle fractal formation…then it goes back to the timestamp of the data feed that Wally and I were discussion. A GMT+1 data feed gave a STH fractal where a GMT feed didn’t.

Interesting to consider the implications of this because as we see here, it can lead to differing analysis of market structure.

For those inquiring minds…


:eek: Thing of beauty is it not?

GLGT

just another footprint in the sand

Live Session at 9pm EST for today’s market review.

It will be recorded and linked here for those who can not join it live.

[B]GLGT[/B] :57:

yipee I can finally make one

ICT, didn’t you predict this thread to be the highest viewed on babypips by Jan. 6th? Looks like you might need to release one of the presents to boost it another 10K views to make it…just my suggestion…lol

OMG my computer skills suck, I just down loaded mt4 a cupple of days ago and cannot find pivot points can anybody point me in the right direction?

Hey Guys…Just wanted to call attention to the divergence and a pattern on a higher TF chart similarities on the Cable back in 2010.

First Chart…Shows divergence on the EU and GU using Week of Nov 20, 2011 as a reference point. EU has gone pretty far below that level. GU still has yet to close below that level even this will be the 4th consecutive week of the EU closing below that level. This was a ITL for both pairs established in the same week. EU has been below it for a month. GU has not closed below that weeks level yet.


Second chart. Shows divergence on a daily chart using closer reference points. Today is set to close below the Dec 29, 2011 EU low, while the GU is not. Another bullish divergence.


Now…we don’t use the presence of divergence to initiate a trade, rather confirmation. I just watched the reversal market profile video (about 9 minute silent video). This 3rd chart highlights the GU weekly. The first blue rectangle…note that we established a swing point low on the weekly chart the week of Sep 5, 2010. Price went up, retraced, but didn’t break this 1.5490 level, then went up to 1.6744…a 1400 pip move up established April 2011 which is out LTH reference point on the Cable.


If you were to drill down to an hourly chart, you would see October 4th was a ‘reversal market profile’ day where it looked like a sell day, then LC/late NYO price reversed and went higher through the NY, LO, and Asian highs, consolidating around 1900 GMT. Then on 10/6/11, there was another late in the day rally (although didn’t blow through the NY/LO/Asia highs as the move down was aggressive).

We saw price reverse using the reversal market profiles at this key weekly level before. We’ve seen 2 significant bounces off this level since Sep 2010. Careful trading if your looking for sell days. We could have a reversal coming up again at this key support level.

The chart in 2010 established this level, then price went up, retraced, but didn’t quite reach it, the launch higher. We could be in the retracement phased repeating the pattern from before.

The market seems primed to potentilly move higher…COT data pointing to commercials being long. very key long term support level in our sights, and buillish divergence forming on higher timeframes.

GLGT
Stay tuned I got an awesome pivot indicator but I am not home. I will be home in a couple hours and will post it.

You can wait for Bob’s indicator.

Most here use the ICT pivot macro which is available in the first post under ‘traders resources’. This seems to be what most have. One minor drawback is it doesn’t plot mid levels, only the pivots. One big feature is it plots pivots for days going back in time on prior days.

Another one people use is sdx-tzpivots. (google it). This one plots mid pivot levels for you, but only plots current day pivots and doesn’t go back in time.

I have both on mine and switch between them as needed, or plot the mid-pivot levels myself using a fib drawn on the pivot points and plotting a trendline on the 50% level.

Hey guys, if you do not mind, could someone help me out with this…
I am having a fair run now in predicting the daily directional bias, but I have a major issue finding an appropriate exit price… Take the past two days for instance - Wednesday I shorted the EU at 1.3062 and exited at S1 - this based on the 100 fib level after taking the fib and pulling the 50 level to the swing low from which I drew the initial fib entry. As a result, I missed a further movement downwards of 71 pips. Today, I shorted GU from 1.5620 down to S2, again based on the 100 fib level after pulling the 50 level to be in line with the swing low. In both cases the 100 fib level lined up with a daily support pivot. On this one I could’ve held it for a further 62 pips.

What can one use besides the 50 / 100 fib levels in predicting the level at which price begins to slow down for the day, particularly where price has gone waaaay past the ADR high / low?

I like the 128 fib myself. Works well for me. the 161.8 works to if price blows past 128 fib level

Can you provide a little more detail. You give entry price, and exit price. Are you scaling out profits to let some run for the fences?

If your capital is such that scaling out isn’t an option, not much you can do. Take the profits and build the account.

If you have the ability to scale…take some off to get to breakeven, then some more to bank some profit, then let the rest ride.

It’s tough psychologically. Any way you do it, you’ll find you’re leaving profits on the table some of the time. Try to give some focus on days when you end up more profitable. I.E. Scaling out will get you the big pip days, but may not give the return on capital because not every day is a big pip day. If you leave some on, the LC close goes against you, you’re giving profits away.

It’s a balancing act without a clear answer. But mainly, your trader psychology is a big role. Is seeing these profits remain on the table causing you to overtrade, or use more risk? Are you getting emotional about it? Will it affect future decision making?

These are the psychological questions you need to wrestle with. Any exit system will leave profits on the table, or not be as profitable as it could have been.

Various methods of determining the target…

Correct me if I am wrong …

This level is the price Sunday opening.


hmmm I am not sure how to upload the file but it is called ZMFX all pivot levels v2.ex4 I got it off google so I am sure it is not hard to find if not I am sure someone can either send you the file or let me know how to do it.

I have a question on the Asian Session.

For the last few weeks in a row, the Asian market has a strong correlation with the trading day going in the SAME direction for Fiber. IN other words, if Asian session was low, the rest of the day was lower. Asian session ended higher, rest of the day seemed to be choppy. Am I on the right track here? I thought the probability is on the other side of where the Asian session meanders off. So if Asian session ends low, I’m looking for a subsequent negative Judas swing and then a Fiber rally. I understood the correlation between Asian Session close and the remainder of the day to be inversely proportional (not 100% of course). But the market has been behaving the opposite way.

Did I understand this incorrectly? I"m learning MQL and will design a backtest in the next few weeks but in the meantime, I’d greatly appreciate it if someone can clear this up for me.

Always look to the left. ICT has been saying look at least 3 days. Banks are going to be hunting for those stops. Then I would look at your extensions, key S/R, pivots, etc. to see what lines up with those stops. If we break the ADR early in the day i would at least try to hold till LC or 18:00gmt. Also remember to take 30 pips and move SL to BE. If it turns out to be a reversal day at least you get paid for being wrong.