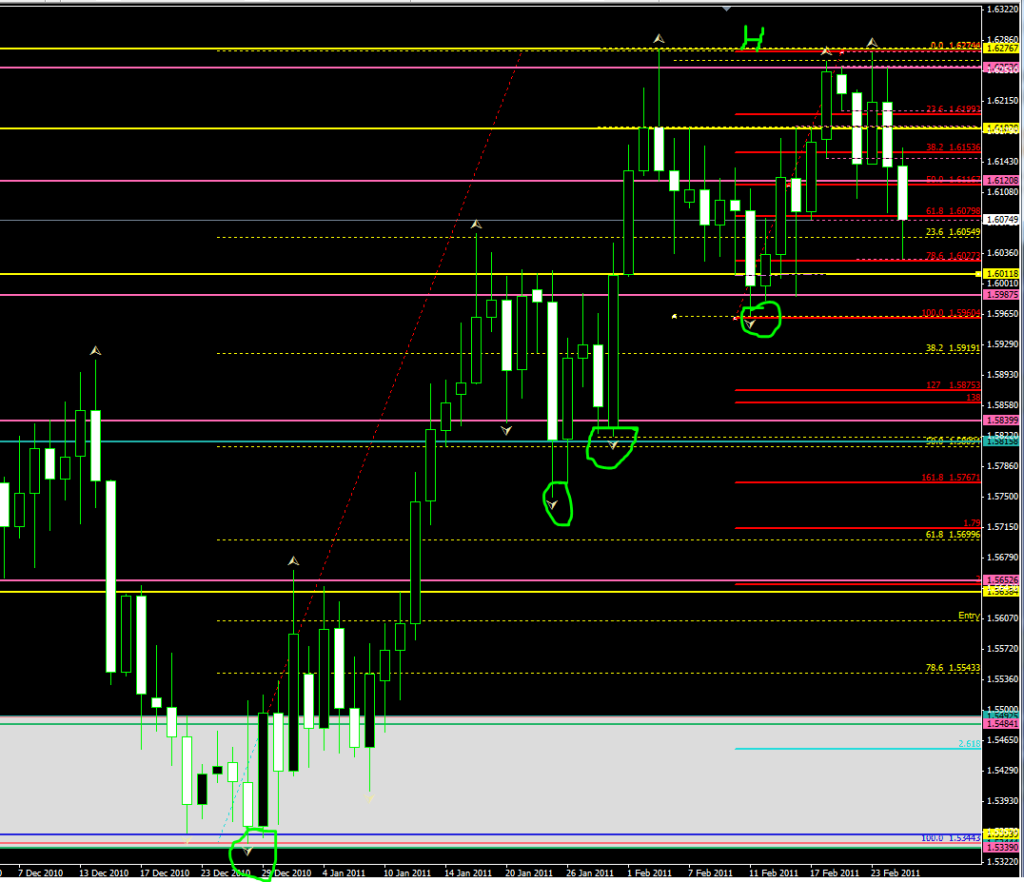
This is daily chart, the fractals are circled. Technically the money flow is long since we have yet to break a previously low fractal (daily). The current pullback today stopped at the 79% from the last bullish move. At this level we have (not shown) a weak s/r line from back in Nov. Also we have the Weekly 23.6% fib drawn from the weekly push up. Sitting 14 pips from where pa stopped is a weekly s/r level as well.
COT data shows Commercials very net short (haven’t seen today’s release as of writing this). US GDP news was less than expected. GBP is rumored that a rate increase will occur making the GDP more desirable to hold than USD.
I think the logical TP on a long held will be the very hard resistance sitting at 1.6276 as that is the retest point that keeps failing to be broken now for a few months.
It is a position graph of Oanda’s open positions from traders. It is neat to see what that graph is doing v. the COT data and such and which currencies they are trading mostly (EU)
Hello if you look at SMT of daily (which is also at major resistance level) chart suggest that top has been made (rephrase needed?) ; COT major shortage (and most of OANDA users are bearish); 4h market flow south. Is this enough to consider long term perspective bearish?
Hey Rokas! Today’s COT data was out and commercials really piled on the net short position (almost -80) which I think means they are hedging against further up movements. The Oanda info is interesting, 95% of all traders are wrong and most retail traders are wrong, so if they are all bearish we should go bullish!
GBP commercial “smart money” reduced net short position by almost 30% according to this week’s data…
last week net short: 66,435
this week net short: 47,103
If I’m thinking what you’re thinking, do you really think these participants would have been loading up so far in advance of the event? :eek: Also would corporate flows be attributed to the bounces up from these levels?
Very nice thread and awesome videos! Just a quick qn though, as a newbie trader, I'm curious whether the techniques you taught still apply during days where key economic news are released. Or rather, would it be more advisable for beginners to avoid trading during these days as the market might be in a chaos and can easily fog our judgement?
A word of caution…this might turn into a Short Covering “exercise” first because of perceived USD weakness.
It means Cable takes a jump up, pulls back…flushes BUY/SELL STOPS and more…after that it takes off. It’s a “cheap way” for speculators to make money in a very large range. There are Offers lined up around 1.6190, already.
Retail traders perceive this kind of PA behaviour as extreme volatility and get scared.
Great video and analysis. Did you know a quicker way to tell the fib price level is to have mt4 print it as part of the description. Just open the fib tool and edit levels. In the description box type in " %$" (without quotes) and mt4 will print the level price as well as anything else you have in there.
I was going to mention is that I notice you click the screen and drag it to scroll. You can scroll with your mouse-wheel, it’s a lot easier :O. I have the feeling you probably already know this, though. The reason I mention it is because I actually have a mouse (Logitech G500) that can unlock the scroll wheel so it doesn’t move in clicks/fixed increments like one normally does. You can basically flick it with your finger so it spins freely and scrolls through webpages (or in this case MT4 charts) really quickly. It might be worth looking into if you find it annoying to scroll through charts slowly!
Hey, ICT that looks like a great resource, but could you please upload it in xls. format aswell? Your other workbooks were in xls., and that enabled those with only 2003 Excel software to download.
Best regards
EDIT: I solved the problem by downloading some ‘compatibility software’ from Microsoft. Here is the link for anyone else experiencing problems:
So the C.O.T. data was out on Friday and the Commercials scaled back on their net short positions by approx 20,000 contracts. My question for this morning is, because they are still overall net short, are we still looking for short trades when considering C.O.T. bias?