I think this may be where my problem lies. I understand all of the numbers (kinda, but I’ll get there eventually :)) but it was the ‘what buttons to press’ part that was stumping me. I think the problem may be with my broker; I’m demo trading on Alpari UK and the problem is that when I edit my trade, the ‘Volume’ field where I set my lot size on new trades is greyed out and I cant change my lot size once the trade is active.
I may try the another broker to see if I get the same issue just to be sure it isn’t just the nut behind the keyboard ;).
I’ll give the 2nd approach a try tomorrow - markets arent moving enough for me to try it out now.
I am real new to this thread so I am demo trading some of the methods. Today I entered short on the turtle soup on fiber at 1.3036 and set a take profit of 30 pips which was hit. I also entered a short on cable at 1.5580 after two fails to go higher on M5 I took a OTE and hit a take profit of 25 pips. I will say nice beginning to the week so far…
ICT is busting out the “Stinger Missile” module…I don’t know if I should be excited or Really Excited…either that or maybe he’s just going to blow somthing up with a missile…either way…WIN !!..
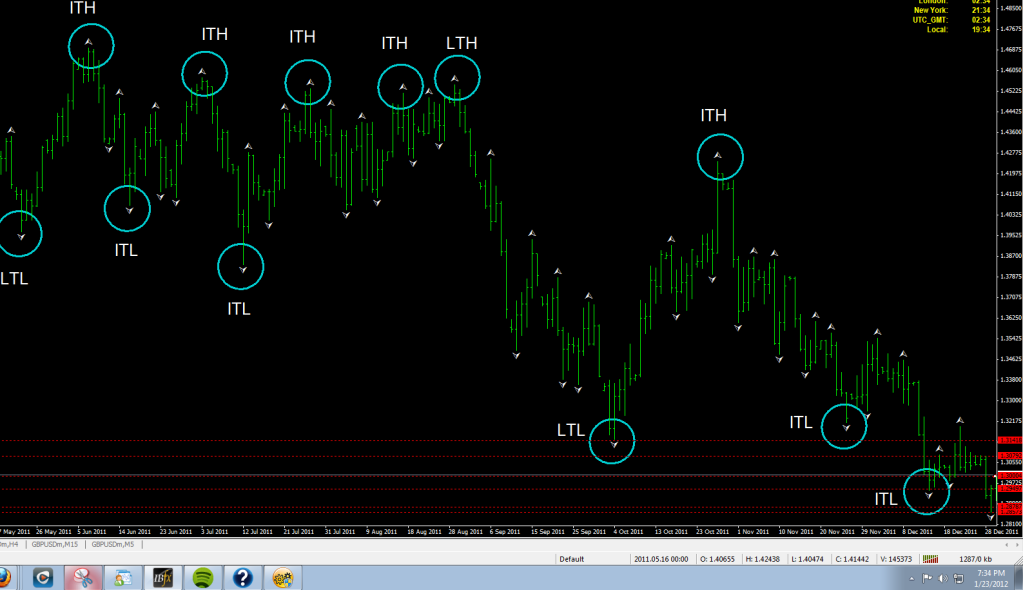
hey matty a very quick way to explain how the structure helps without going to far into it is…lets say you see a Intermediate term low forming while your at the charts, well you notice this by the newest short term low that just formed, and if you see a swing set up like that (brand new Short term low , and before it, an Intermediate term low formed) then you can assume, that the now ITL on you chart was a somewhat major reaction point, and after the STL formed price may be continuing upwards…idk its somewhat confusing to explain but i know others will get into greater detail…
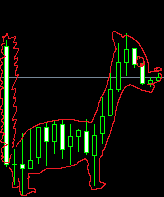
(Then just add in long.term low or high in the same.fashion …I just tried mocking up a quick picture chart so you can get a general idea!
Looks great but like I have told many many people. I can make anything look good on the left side of the chart. Do it on the other side. From what I see there your about to make a imtermed term high. But hmmm I wander. I see S/R hell if I want to I can find ote on that. I am not putting you down here. Just real easy when on the left side. ICT does teach alot here (if not I would not be here) but one thing he teaches way way back is scroll out on the chart. You are way to zoomed in. What happened last week on that chart (assuming it is a 15 minute like I watch). Again no disrespect ment but I am sure most of us can look at the left side of a chart and tell where a high and low is and if it is long term short term what ever. If not this thread wont help you go back to babypips school and try again.
Edit: I take that back he asked. Good job I didnt see that at first. Good answer. I thought you were just trying to show highs and lows. Like I said why you better know that to be here. But fractals are different (not really). All in all I would delete this but babypips wont let me so… We will all fight again another day I should read all the posts before reponding next time lol.
If I recall correctly in one of the most recent livestream videos ICT was using a 10 period stochastic, but in the ´How pros use indicators’ video, he shows as an example a 14 period stochastic. So which one is it?. I´d like to be in the same page as everyone else.