I stand corrected…I will respectfully refer to you as ‘Sir’ from now on, and not ‘lover boy’:13: It is nice to know that others are also coming to this mid-career, and not early on…has anybody else ever considered that forex, once fully understood, could be the most recession proof job in the world?
I was being extra cautious last year when I considered this…my business wasn’t suffering, but I felt an urge to learn more skills in order to protect myself against that unknown future you talk about. Well, the worst case scenario came true on March 11th, and I am glad I had 5 months headstart on it. Thanks to ICT’s timely tools, I have options, and boy do I need options right now:26: I know Michael has a kind heart, and I am sure that he took on this mentor role knowing that he could help change people’s lives, and not just their trading, but did he ever consider that he might be able to help people escape nuclear meltdown?!! It is no exaggeration to say that without his work, life would be a whole lot grimmer than it currently is.
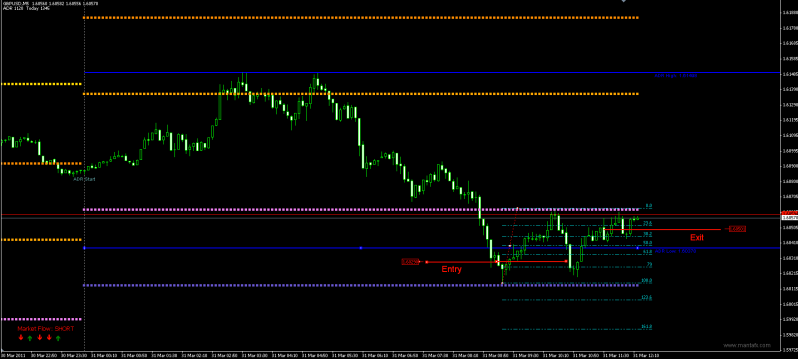
Well, back to business before I get all emotional! I think you might want to take a look at the 5M chart aswell if you are looking for London Close scalps. ICT did say you could rely on the 15M chart, but I think he was trying to get us to only take the best of the best LC Cable trades i.e. ones that give you plenty of time to get set-up because they have a good long swing on which to place your Fib. Yes, some of my more successful trades have come when the high has been made a few hours before the LC kill zone, and the OTE comes in during the zone (easily picked up on 15M), but I have had an equal amount that I wouldn’t have spotted if not for the 5M. Even last night’s little scalper…I wasn’t going to trade at all because I had had a rough day, but I saw this set-up right after our conversation about LC trade times, and I couldn’t resist. You’ll notice that I didn’t get in at the perfect entry (bang on 79% retracement), but left it until I was confident I was seeing what I thought was an LC trade. I in fact entered a few candles later with an OTE on the OTE :o and I wouldn’t have been able to do this if it weren’t for the 5M chart.
I’m always interested in seeing where everyone else is with the LC trade. Maybe we could compare notes. I have put a few things down in writing here, but every time I try to post, it won’t accept it. Maybe because the post is too long? I will try posting in smaller parts.
Recently I have had 8 windows open at once, which sounds a lot, but on my 24 inch screen I get a good sight of the ADR numbers in the top left hand corner of each frame. I keep them all on 5 minute timeframes. If I see a reading like “ADR 1560 Today 1400”, then this is enough information for me to start taking a closer look. What I do is maximize the 5 minute timeframe, move up to Daily, then do a quick top analysis through D1, H4, H1 noting any important support or resistance in the near term. I then put up the pivots, and note any confluence with institutional numbers. I then sit and wait for the ICT_ADR line to turn blue (the signal that price has crossed out of the range) if it hasn’t already done so earlier in the session. Before now, I was closing down the windows of all the unnecessary pairs, but I found that I missed a few potentials because I had ruled them out too early i.e. they moved out of the ADR with late swings.
Once we have the blue light, and a previous high/low has not already been made, then that is the signal to look for one. Once that is in place (most probably it stops at an SR level), then I move on to thinking about 20% retracement.
One little trick that I have thought of in order to figure out whether price has retraced 20% of the day’s range is to put a 20% retracement level on my Fib. That way I can quickly draw it from Day High to Day Low, find the 20% level, and mark it on my charts. You usually have at least 20 mins from Day Low to 20% retracement where you will draw your OTE Fib, and so it is nice to have the level marked so that you can get on with analysis on other charts. You keep one eye on this line, and if the line is met and price starts to turn, then this the signal to move onto the next phase: drawing your Fib. Once that Fib is in place, you look for OTE and set a Limit order and wait.
If you find that there is confluence at the 127% retracement level above the OTE, then be cautious as price has an equal chance of making it up to that level (Fake out?). If you are looking at a tight swing OTE entry then chances are your SL might be above the 127% anyway (this has saved my skin on occasion) but you may be caught out on larger swings.
So, once again, that is where I am at. Should I be doing more experimentation with Williams %R, MACD, or other indies…I just don’t know! I don’t want to stray too far from the ICT track. Hopefully we will get some new nuggets of information soon
Regards
P.S.
I also keep a spreadsheet handy with all of the pairs current pip values so that I don’t get caught out risking too much or too little. I think this is important when working with multiple pairs as it would be so easy to mess up your lot sizes.
Yesterday I took some longs on EU from 1.4071 and from 1.4097. I closed 50% at 1.4180 and target for remaining 50% is 1.4249.
Here is the basic idea why I took the trades. I went from H4 OTE zone. The important area is where the market flow on high timeframe (H4 or D1) changed its direction.
EDIT: This pattern works on every timeframe. Watch for a while M1 how and where the market flow changes.
Yeah… Notice the 1.4050 around which price always seems to bounce back with strength when reaching that area. ( Barrier there? ) Hence on demo when price approaches that area, went long with profit targets at R1 since major support at 1.4050 area and i think that price will likely give up to retest that area anytime soon and resistance on the other hand haven been tested.
On the longer term too, looks like price will likely push for the last fractual high on daily charts. Remember ICT mentioned this in one of his video and looks like the market will repeat itself here again.
Not sure whether anyone had the same analysis as me yesterday though as me still a newbie.
I have had a resistance zone marked on my chart around the 1.4050 mark for a while - if you squeeze up the chart it has been a key area for a while. I have another resistance zone marked around 1.4250, as well. I shorted from there a few days ago, hoping Price would punch through the 1.4000 mark. It did not (obviously!) so I took profit around there yesterday and then went long, off the bar on the 240, aiming for just shy of the 1.4250 resistance. I made 3% on the Short, so my 1% risk on the Long is already covered, but the simple answer is yes, my analysis is similar to yours, if that helps confidence levels.
Thanx Simon. Glad to see i am on the right track even though it is still a baby track.
Anyway looks like the fiber justed bounced off the R1 which is also in the OTE if we draw the Fib from today low to high so far. Looks like price wanna push for your 1.4250 level or at least the high of 1.42479 of the past few months?
But then price hit the ADR high of today twice and failed to push through so maybe will need to wait till tommorrow early session for the price to push to 1.4250??
Just a newbie analysis though.
EDIT: Btw anyone can help with ICT’s PivotDailyMacro?? If our MT4 system is using EST so does that mean we do not need to adjust the hourshift to -5??
Great work, Hordane. I don’t want to seem like the boy in the candy shop who wants it all, but would it be difficult to put in an option to remove the labels or place them further back on the charts? When you have all the lines for up to 4 periods marked, that becomes a lot of labels getting in the way of your candles. I like the way you programmed it so that when you scroll the mouse over the line it tells you what it is, I think in that sense the labels are unnecessary. I have set them to blend in with my background for the time being, but when I enter the kill zone, I have to change them to kill zone colour! Just my 10 cents.
Regardless, thanks a bunch for all your hard work.
Frustrated with Cable messing around at the 1.6050 level so got out for 17 pips. Think it is probably going to the central pivot but I’ve got the dentist first thing and it is nearly 1am. Another 3:45GMT entry, Jaroon!
Here’s the easiest way to figure this out. Draw a vertical line where 00:00 GMT and 00:00 EST are on your chart. For GMT pivots you’ll want the new pivots to be drawn at 00:00 GMT, for EST (new york) pivots, you line up the new pivots with 00:00 EST. This avoids any confusion with discrepancies between ICT’s settings and your settings.


