Here are my pivot points for today. Please let me know if you have the same levels.
Thanks
Gbp/usd
R2 1.5171
MR2 1.5144
R1 1.5116
MR1 1.5073
PP 1.5030
MS1 1.5003
S1 1.4975
MS2 1.4932
S2 1.4889
Here are my pivot points for today. Please let me know if you have the same levels.
Thanks
Gbp/usd
R2 1.5171
MR2 1.5144
R1 1.5116
MR1 1.5073
PP 1.5030
MS1 1.5003
S1 1.4975
MS2 1.4932
S2 1.4889
15173
15146
15119
15076
15032
15005
14978
14935
14891
per GFT data
Thanks and my pleasure
Mine are very close…off by a pip or two. Now I used 00:00 GMT for the close, but the highs & lows would still be the same, although I suppose the brokers feed could be out a pip or two as well.
High = 1.5086
Low = 1.4944
Close = 1.5059
Those are exactly what I get :)…but I’m thinking your close just happened to land back at the same price it was at 5 hrs ago…lol
Cool, thank you 
Same high; low and close differ by one pip, I’m using Gft data, but I don’t have the same levels as ICT :rolleyes:
Why everyone should run thier own numbers to be in sync with their data providers.
I trust this week’s installments provided some stimulation and aided in promoting patience in your trade selections and how it can provide 50 pips or more candidates if you are willing to wait for them.
This weekend I will cover how I do my homework and document my trades and stalk my trades and how I journal my progress. I will cover optimal trade entry concepts which lower risk and provide higher rewards. As well as Top down Analysis examples.
That’s totally awesome and appreciated, but don’t compromise your recovery!..(wow…do I sound like mother hen here…:D)
My trading made huge leaps forward when I first read “Technical templates” by Tess and Jocelyn et al, and realized I didn’t need indicators to understand what the market was telling me (and that it was actually telling me things thru price!).
And now I feel that same sense of progress with this thread. I’ve been having moderate success with weekly highs/lows, but the pivots increase my trading opportunities and help me make sense of the price action in between the highs and lows now too!
Threads like this are golden, I hope everyone can learn as much as they can for as long as you’re around.
Here you have it again… the tools are nailing the swings right on the money. The attached chart completes my trading for this week. I hope you find it helpful and hope you caught it. 
I realize I spelled objective wrong, but too tired to fix it and closing a profitable week here. 
100% Agree and that’s precisely what I’m doing personally. Learning as much as I can.
This is my personal goal. A Sniper 

By travpip at 2010-03-12
wife insisted i take her for dinner, so i placed entry order just above todays CPP and at the asian session low. I thought it would go down and perhaps touch the CPP before moving up to todays high and R1, but it took off 3 pips ahead of my order, unfortunately, and promprtly reached my take profit target at 136.89 in quick time.
So i returned from dinner with my order sitting there lonely down at 136.1 and i missed out on 90pips. oh well the dinner was okay.:eek:
Great job, it’s been quite an experience being part of this journey.
Thanks for taking the time to share.
Wish you a quick recovery.
I was wondering what are the open and close points to calculate monday pivots.
I was thinking about Friday 12:00 a.m. for the open to sunday 11:59 p.m. for the close (New Yort time)
Am I right?
Thanks.
Hi InnerCircleTrader, very nice thread! Pivot points are very strong! 
I have a question for you: What happens if price open between the high of the previous day and the pivot point of the present day, and start to go down. In this case should we wait until the prices break pivot point and look for long signals?
Example:
High of the previous day: 1.3800
Low of the previous day: 1.3662
Central Pivot point: 1.3670
Thanks!
To quote ICT:
“Pivots are intraday milemarkers in a sense. markets try to swing to these levels and based on the flows once getting to them we can anticipate a reaction.”
Does that help?
Like this:
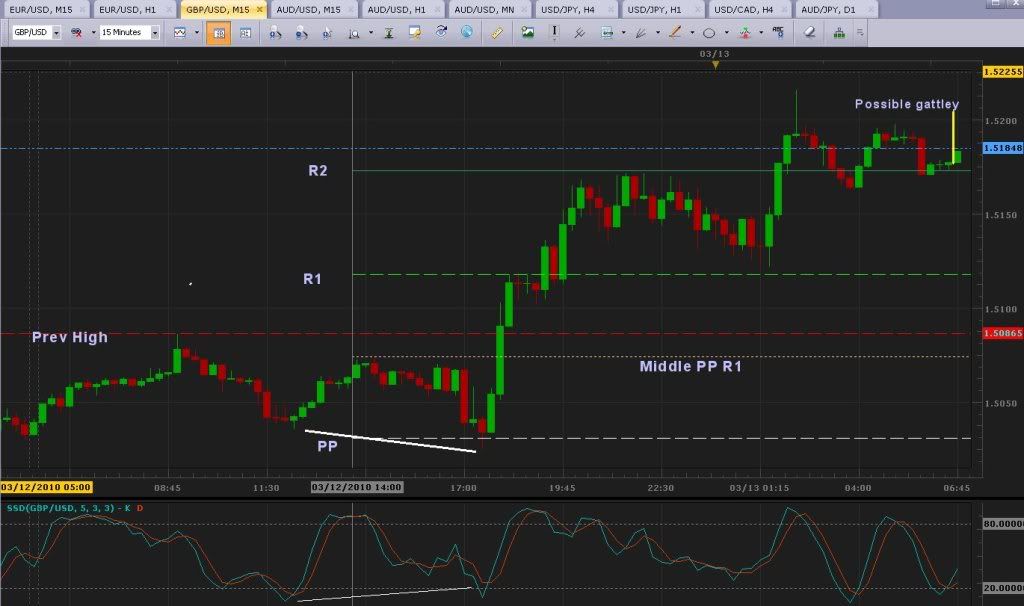
http://i372.photobucket.com/albums/oo170/mcawally/GBPUSD15.jpg
Opens under the previous high and the mid pp r1 line and moves down to the central pivot (PP). Higher Time Frames show an upward bias, trend or flow so we are looking to go long. As the price approaches the the PP
we go long looking for a bounce up, notice the stochastics divergence for a bit of confidence, first target is the mid PP R1 then R1. Perfect so far. 
Then you can see a bull triangle (probably see it better on a 5m chart) form underneath R1 so maybe place a long order just above R1 next target R2.
Perrrfect…
And just to make things interesting, after breaching R2 and acting a bit silly, it seems to be forming a Gattley pattern just before everyone picked there bats and balls and went home for the weekend 
This thread is really helping my natural bent of trading, all the elements Ive been trying to trade wrapped up in one fine package.
Thank you ICT.
Wally
Opens under the previous high and the mid pp r1 line and moves down to the central pivot (PP)
Sterling formed a Lo during the [B]first 4 hours of current day market[/B] operation.
PP acted a support & Sterling took off from there.
This Lo forming price behaviour during the first 4 hours of current day market was visible across a number of instruments last Friday.
Just like ICT said it would & posted in his instructions what to look for.