Wheat Technical Analysis Summary
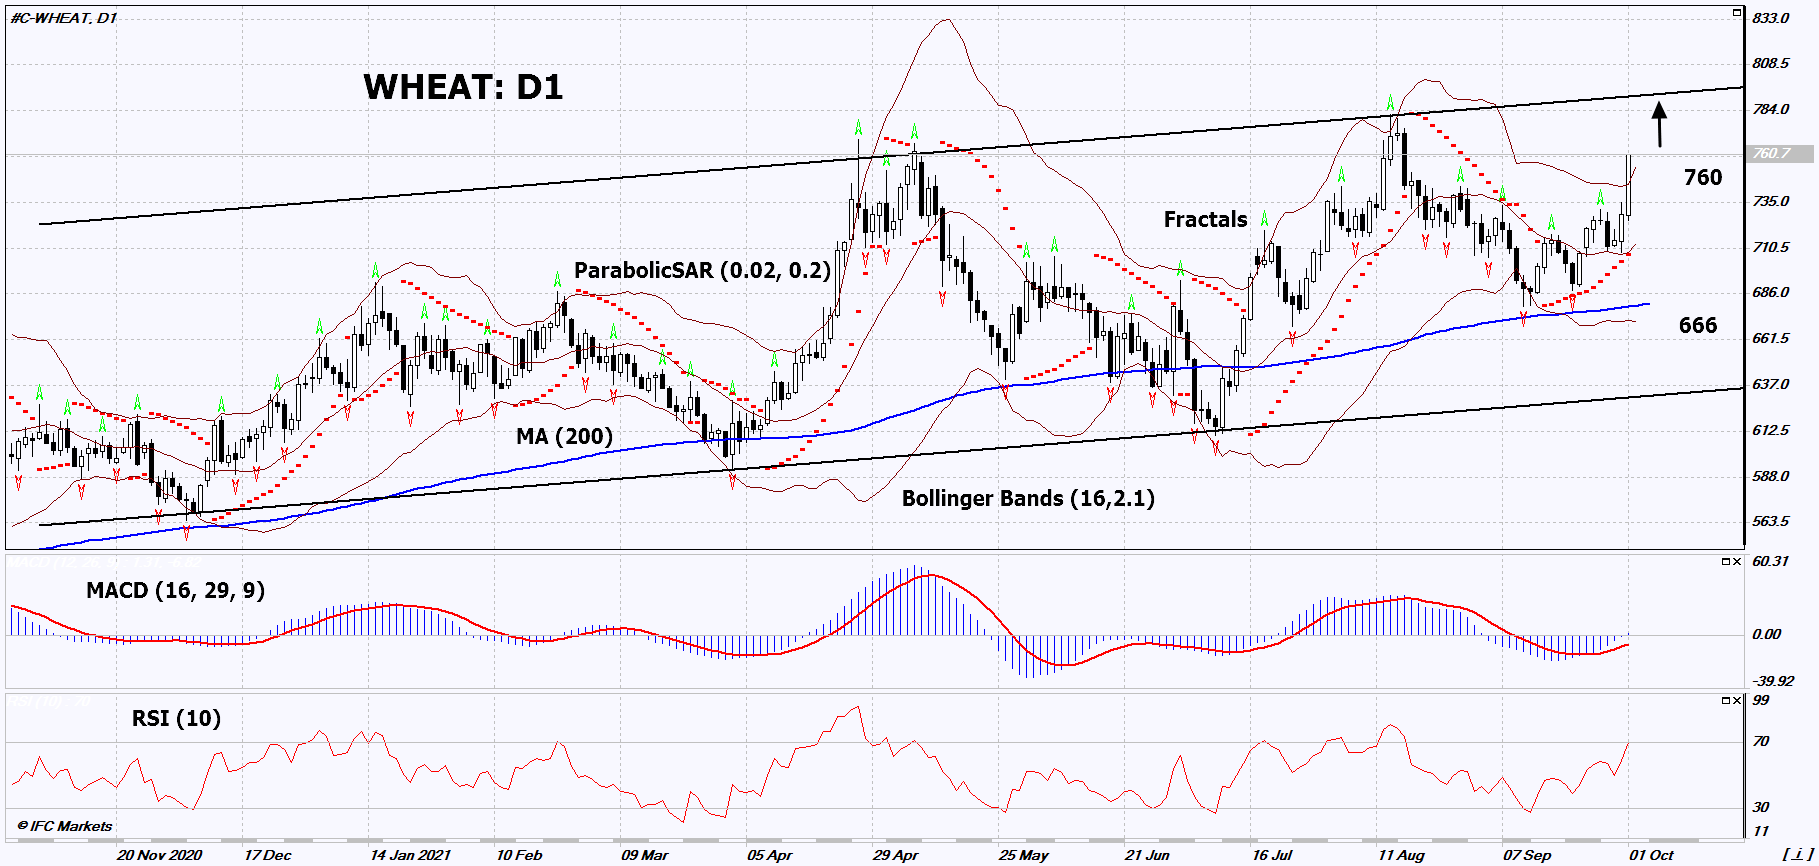
Buy Stop:Above 760
Stop Loss:Below 666
| Indicator | Signal |
|---|---|
| RSI | Neutral |
| MACD | Buy |
| MA(200) | Neutral |
| Fractals | Buy |
| Parabolic SAR | Buy |
| Bollinger Bands | Buy |
Wheat Chart Analysis
Wheat Technical Analysis
On the daily timeframe, WHEAT: D1 is moving towards the upper border of the ascending channel. A number of technical analysis indicators have generated signals for further growth. We do not rule out a bullish movement if WHEAT rises above the last high: 760. This level can be used as an entry point. The initial risk limitation is possible below the Parabolic signal, the last two lower fractals, the lower Bollinger line and the 200-day moving average line: 666. After opening a pending order, move the stop following the Bollinger and Parabolic signals to the next fractal low. Thus, we change the potential profit / loss ratio in our favor. The most cautious traders, after making a deal, can go to the four-hour chart and set a stop-loss, moving it in the direction of movement. If the price overcomes the stop level (666) without activating the order (760), it is recommended to delete the order: there are internal changes in the market that were not taken into account.
Fundamental Analysis of Commodities - Wheat
The lowest wheat harvest in 19 years is expected In the US. Will the WHEAT quotes continue to rise?
The United States Department of Agriculture (USDA) lowered its forecast for the US wheat harvest this year by 51.2 million bushels to 1.646 billion bushels. US wheat stocks may shrink to 1.78 billion bushels from 2.16 billion bushels last year. Note that the demand for US wheat in the 1st quarter was the highest in 8 years and amounted to 896 million bushels. An additional positive for wheat quotes may be the forecast of the National Oceanic and Atmospheric Administration that rainy weather and the formation of a storm are possible in Texas.