Hello fellow traders. Another instrument that we have been trading lately is Wheat ( $ZW_F) . In this technical blog we’re going to take a quick look at the Elliott Wave charts of Wheat ( $ZW_F) , published in members area of the website. As our members know, ZW_F is showing impulsive sequences in the cycle from the 469’5 low which makes Wheat bullish against the 565’6 low. We advised members to avoid selling $ZW_F and keep on buying the dips in the sequences of 3,7,or 11 swings whenever get chance. Recently the commodity made pull back that has given us nice opportunities to enter the long side. In further text we’re going to explain Elliott Wave Forecast and Trading strategy.
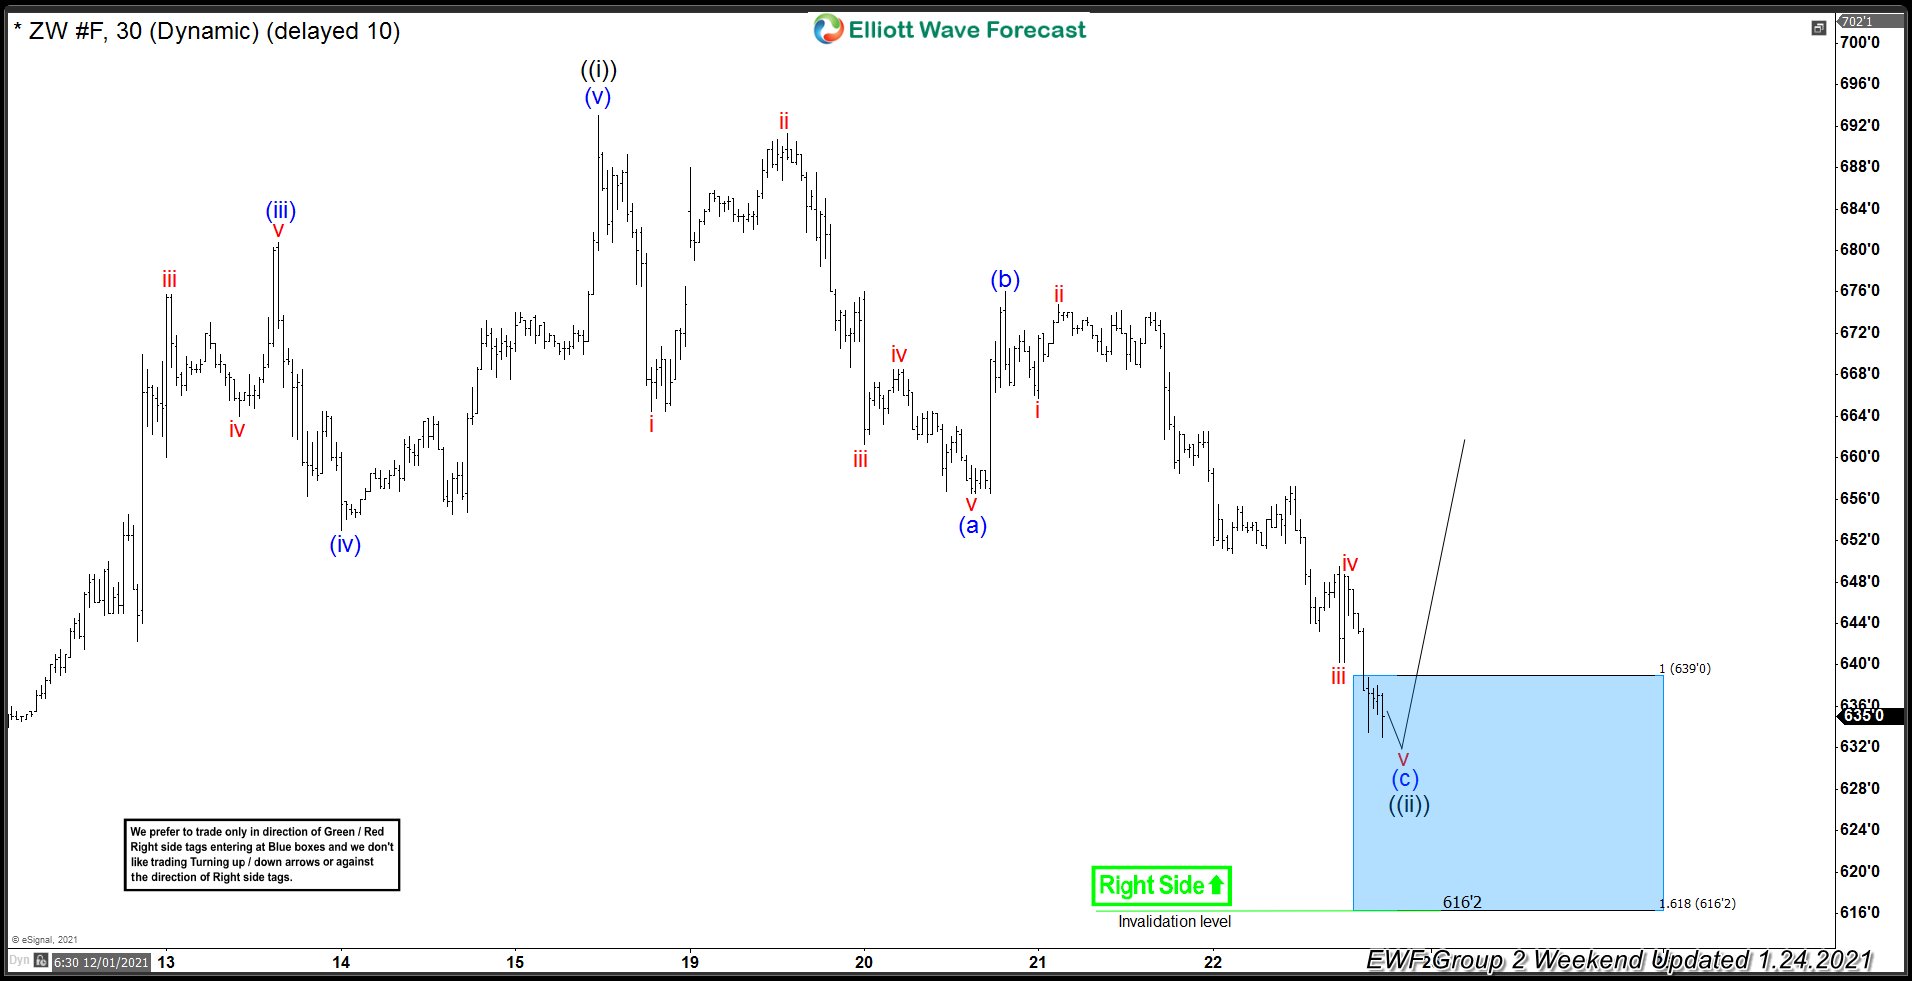
Wheat ( $ZW_F) 1h Hour Elliott Wave Analysis 1.24.2021
The commodity is bullish against the 565’6 low.in first degree. We got short term ((ii)) black that has form of Elliott Wave Zig Zag pattern. The price has already reached equal legs from the peak at 639’0-616’2 ( buying zone). However we see possibility that pull back still can extend within the blue box zone. We don’t recommend selling the commodity and favor the long side from the blue box area. As the main trend is bullish, we should get 3 wave bounce at least from the Blue Box buyers zone. Invalidation level for the trade would be break below 1.6148 fib extension (616’2)
As our members know, Blue Boxes are no enemy areas , giving us 85% chance to get a bounce.
You can learn more about Elliott Wave Patterns at our Free Elliott Wave Educational Web Page .
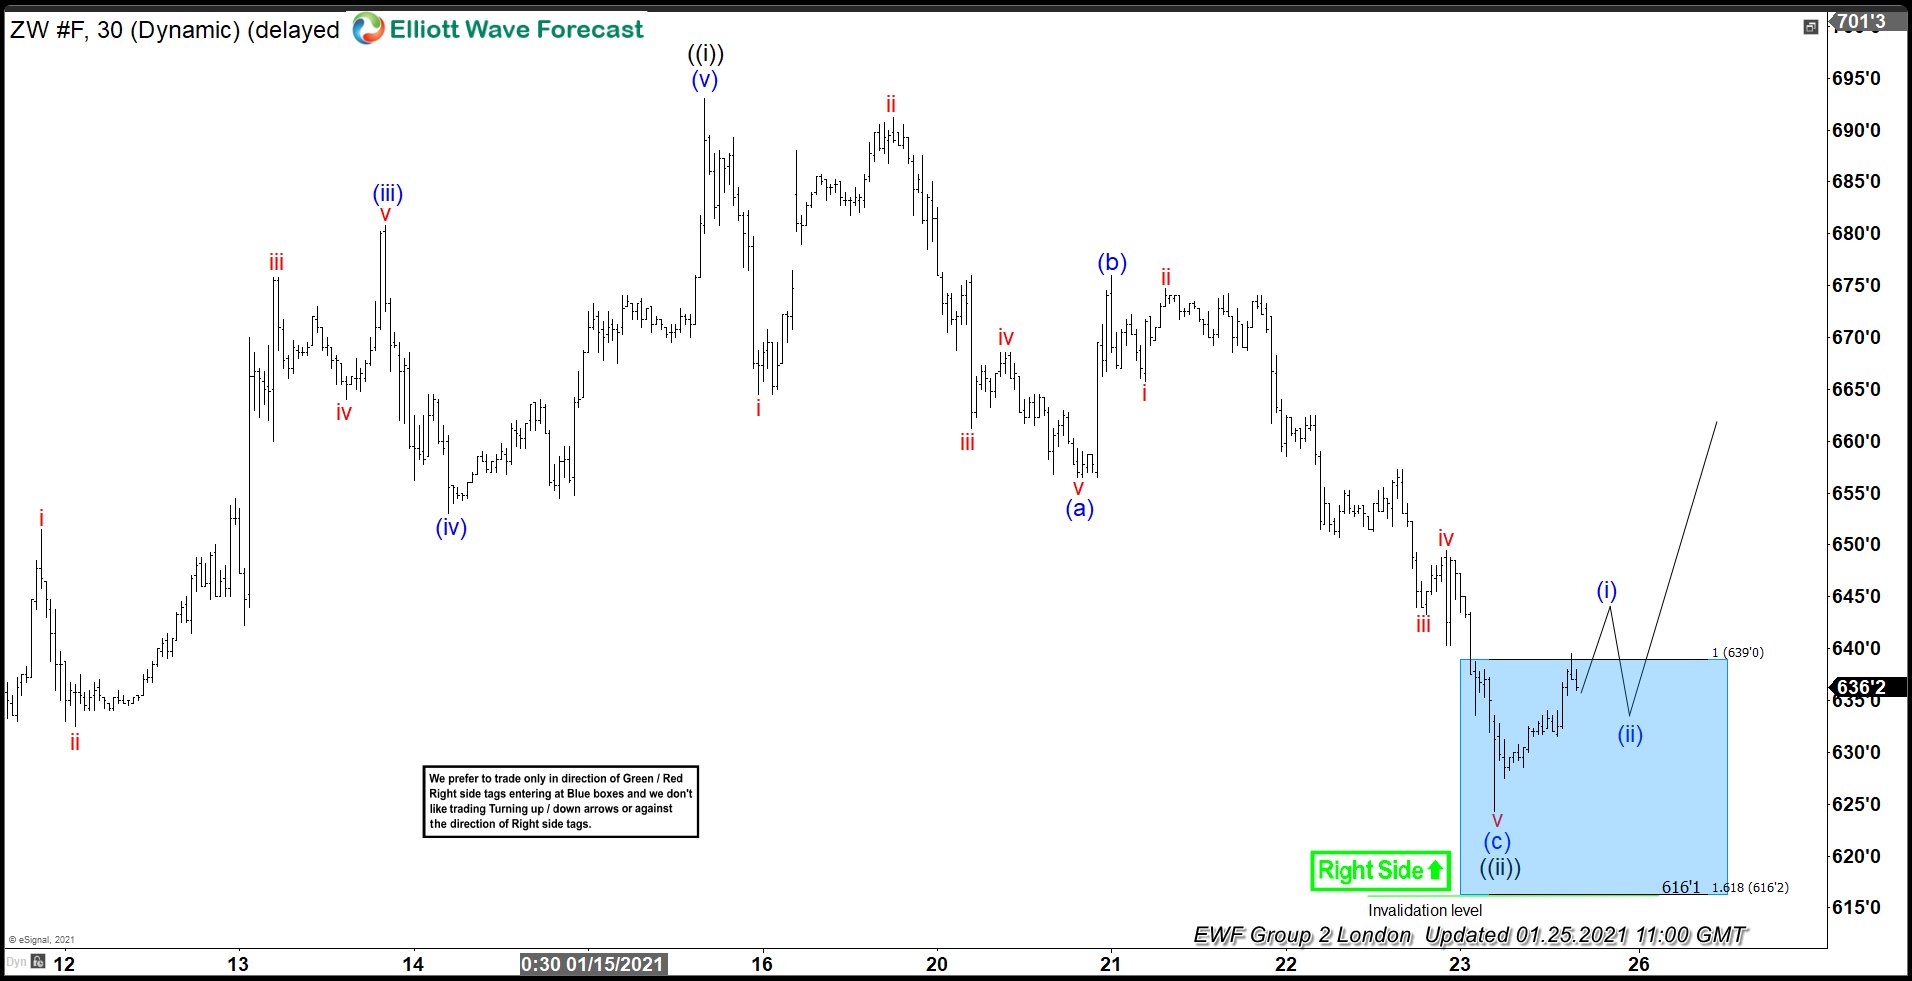
Wheat ( $ZW_F) 1h Hour Elliott Wave Analysis 1.25.2021
Invalidation level 616’2 held well and we call ((ii)) pull back completed at the 624’0 low. However we would like to see further separation from the current short term low. We don’t recommend selling Wheat in any proposed pull back and favor the long side from the blue box. As the main trend is bullish, we should get 3 wave bounce at least from the Blue Box buyers zone. As soon as the bounce reaches 50 Fibs against the (b) blue peak we should make long positions risk free.
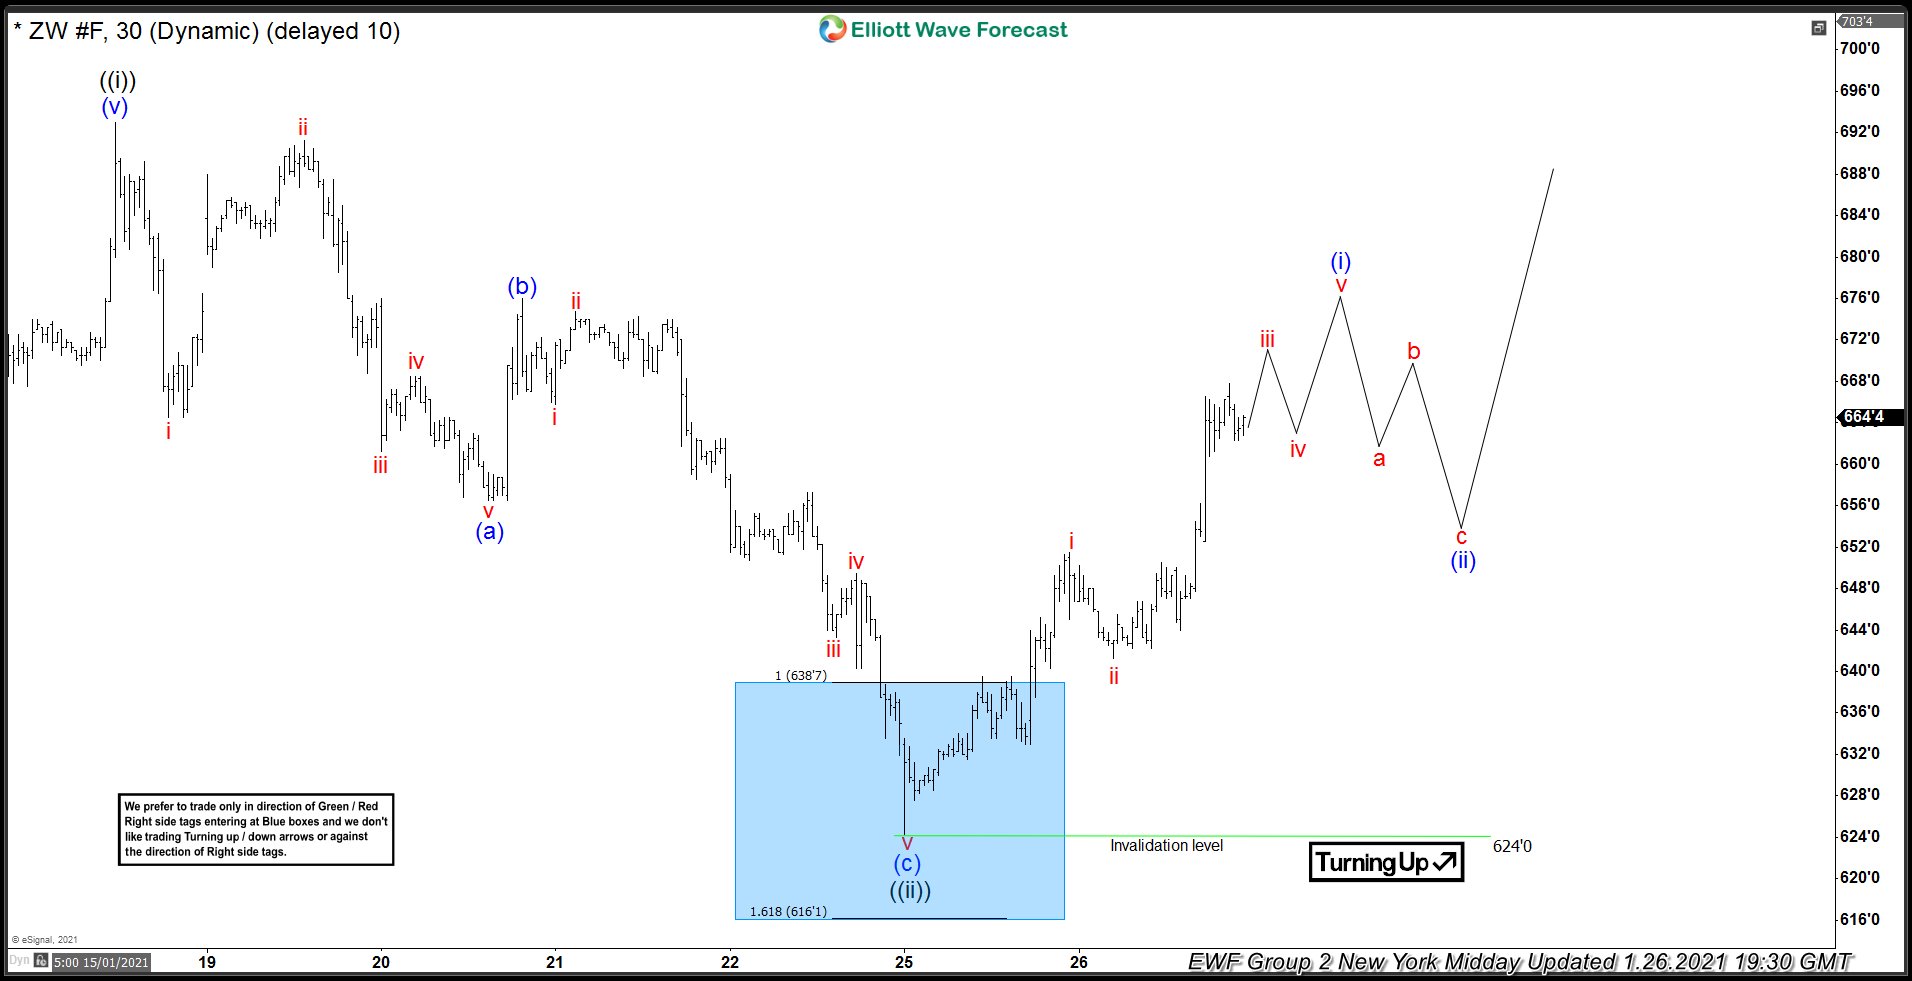
Wheat ( $ZW_F) 1h Hour Elliott Wave Analysis 1.26.2021
Wheat made further separation from the 616’2 low as expected. We got decent rally which has exceeded 50 fibs against the (b) blue peak. So , members who took long trades at the blue box are now enjoying profits in a risk free trades. We expect to see further rally as far as 624’0 low holds, however would like to see break above 01/15 peak to confirm next leg up is in progress.
Keep in mind market is dynamic and presented view could have changed in the mean time. You can check most recent charts in the membership area of the site. Best instruments to trade are those having incomplete bullish or bearish swings sequences.We put them in Sequence Report and best among them are shown in the Live Trading Room
Source: Wheat ( $ZW_F ) Buying The Dips At The Blue Box Area