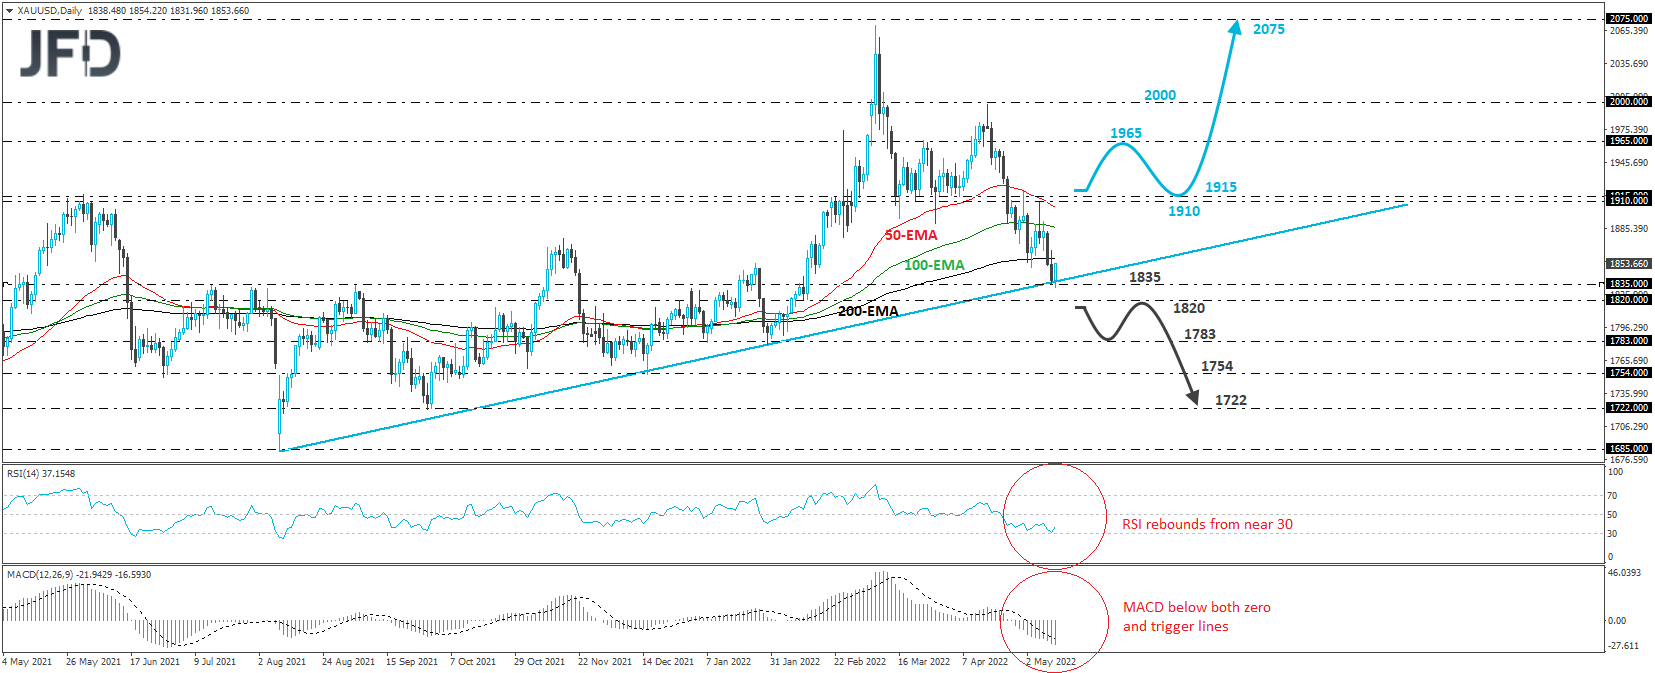
XAU/USD traded higher today, after it hit support at 1835, fractionally below the upside support line drawn from the low of August 9th. The fact that the metal remains above that line keeps intact the chances for another wave north. However, given the proximity to that line, we prefer to take the sidelines for now. We would like to see a clear break above 1915 before we start examining whether the bulls have gained full control again.
That territory acted as a key support between March 15th and April 7th, and it break may encourage more bulls to enter the action. The next stop may be at 1965, marked by the high of March 24th, the break of which could extend the advance towards the round figure of 2000, near the high of April 18th. If that barrier is not able to halt the rise either, then we may experience extensions towards the 2075 zone, which is the metal’s record high, marked by the high of August 2nd, 2020, and slightly above the peak of March 6th, this year.
Taking a look at our short-term oscillators, we see that the RSI rebounded from near its 30 line, but the MACD remains below both its zero and trigger lines. That’s another reason why we prefer to stay sidelined for now and wait for a break above 1915 before we get more confident on an uptrend continuation.
On the downside, we will start examining the bearish case upon a dip below 1820, a support marked near the inside swing high of January 30th. This could also confirm the break below the upside support line drawn from the low of August 9th. The next support may come at 1783, marked by the lows of January 2nd and 23rd, the break of which could carry extensions towards the lows of October 31st and December 12th, at 1754. If that barrier doesn’t hold either, then we may see the sellers diving towards the low of September 26th, at 1722.
Disclaimer:
The content we produce does not constitute investment advice or investment recommendation (should not be considered as such) and does not in any way constitute an invitation to acquire any financial instrument or product. The Group of Companies of JFD, its affiliates, agents, directors, officers or employees are not liable for any damages that may be caused by individual comments or statements by JFD analysts and assumes no liability with respect to the completeness and correctness of the content presented. The investor is solely responsible for the risk of his investment decisions. Accordingly, you should seek, if you consider appropriate, relevant independent professional advice on the investment considered. The analyses and comments presented do not include any consideration of your personal investment objectives, financial circumstances or needs. The content has not been prepared in accordance with the legal requirements for financial analyses and must therefore be viewed by the reader as marketing information. JFD prohibits the duplication or publication without explicit approval.
CFDs are complex instruments and come with a high risk of losing money rapidly due to leverage. 72.99% of retail investor accounts lose money when trading CFDs with the Company. You should consider whether you understand how CFDs work and whether you can afford to take the high risk of losing your money. Please read the full Risk Disclosure.
Copyright 2022 JFD Group Ltd.