World Indices, as we always said at Elliott Wave Forecast, are an easy trade across the Marketplace. Indices by nature will always be trending higher. Unfortunately, many traders do not understand that concept. Our nature is bullish, we are coming from living in caves to where we are right now. Humans have been always looking for new inventions, new technologies, new ways to grow. Human Nature is the fuel that makes the Indices trending higher. Over the years, we have always applied this concept to our charts.
When many voices across the Marketplace have been calling a total crash within the Indices, we have never entertained that idea. As a matter of fact, we have been always bullish and we have adjusted the Elliott Wave Theory to the most possible Bullish view. We have done it and do it until the Market proves us otherwise. Through the years, we have been able to call every important pullback with a high degree of accuracy. Hereby, we used a Technique which is very simple: we have overviewed the entire Marketplace locating those Indices, Stocks and ETF’s which were showing indications of a possible top. Hereby, one single Index, Stock or ETF can not be traded by itself, but it can provide clues. Since the year 2008, the pullbacks became easy to forecast and the warning sign could be clearly interpreted.
World Indices have experienced important pullbacks in years 2008, 2015, 2018 and 2020. In this article, we will explain the reason behind those pullbacks. In fact, there are two ways to expect them. The first one is when an instrument is trading within a Blue Box area. Indeed, 85% of the time a reaction happens from the Blue Box. The other way is when a visible five waves structure comes together. Also, one needs to see all the subdivisions within it to be in place. Blue Box reaction happens, by definition, due to an agreement. Hereby, both sides of the Market, bulls and bears, do agree into a pullback. One side takes profit and the other side enters the Market. In other words, that is how “smart money” trade.
Pullback in Indices of 2008
Let’s now start with the crash of 2008. That is the biggest pullback which the World Indices have ever seen. Indices like $SPY, $SPX among others were ready to rally from the 2002 lows. They made already three waves pullback since the peak in 2000, but they found a huge reason to sell. The following chart is the monthly chart of the Hang Seng Index.

The cycle from the all-time lows in Hang Seng has ended in 2000. Then, similar to $SPX, it saw a pullback into the year 2003. Thereafter, a tremendous rally has happened. Hang Seng has reached the Blue Box target area from the all-time lows. There was no way that that fact of Hang Seng arrival in the Blue Box area will allow the $SPX to enter wave III higher within the Grand Supercycle. So, consequently, the Market was in a need to fix itself. Therefore, another pullback did happen in Hang Seng and the $SPX has performed another leg lower of a flat correction. This example makes it obvious how a Blue Box area can call a pullback across the World Indices.
Pullback in Indices of 2015
The pullback in indices in 2015 was also easy to anticipate using the same Technique. This time around, the Index of reference is $NIFTY. Back in 2015, it was showing a clear seven swing advance from the lows. As a matter of fact, the Market runs always in sequences of 5-9-13 (motive sequences) or 3-7-11 (corrective sequences). The following chart shows a sequence of seven swings into the Blue Box area.
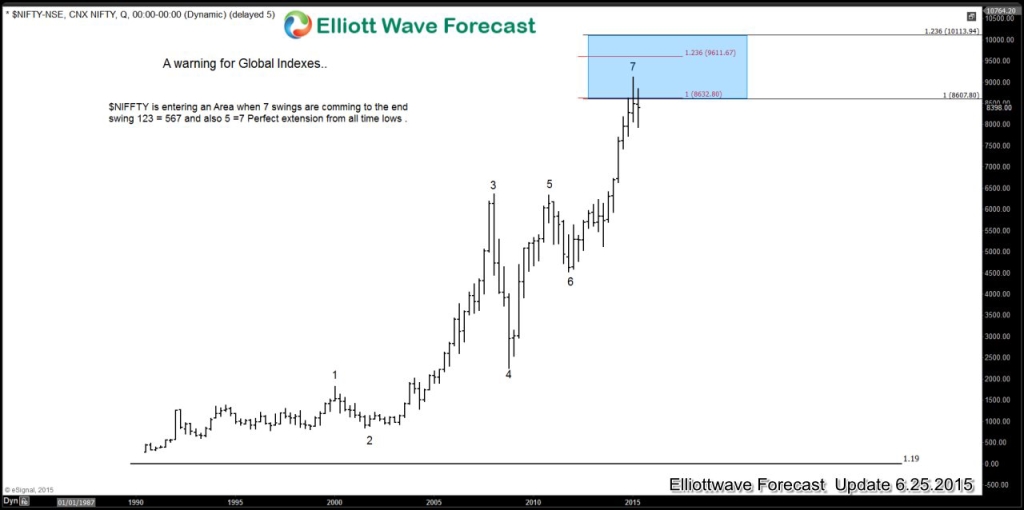
The combination of swings number and Fibonacci based Blue Box extension area was enough to create the pullback of 2015 across the Market.
Pullback in Indices of 2018
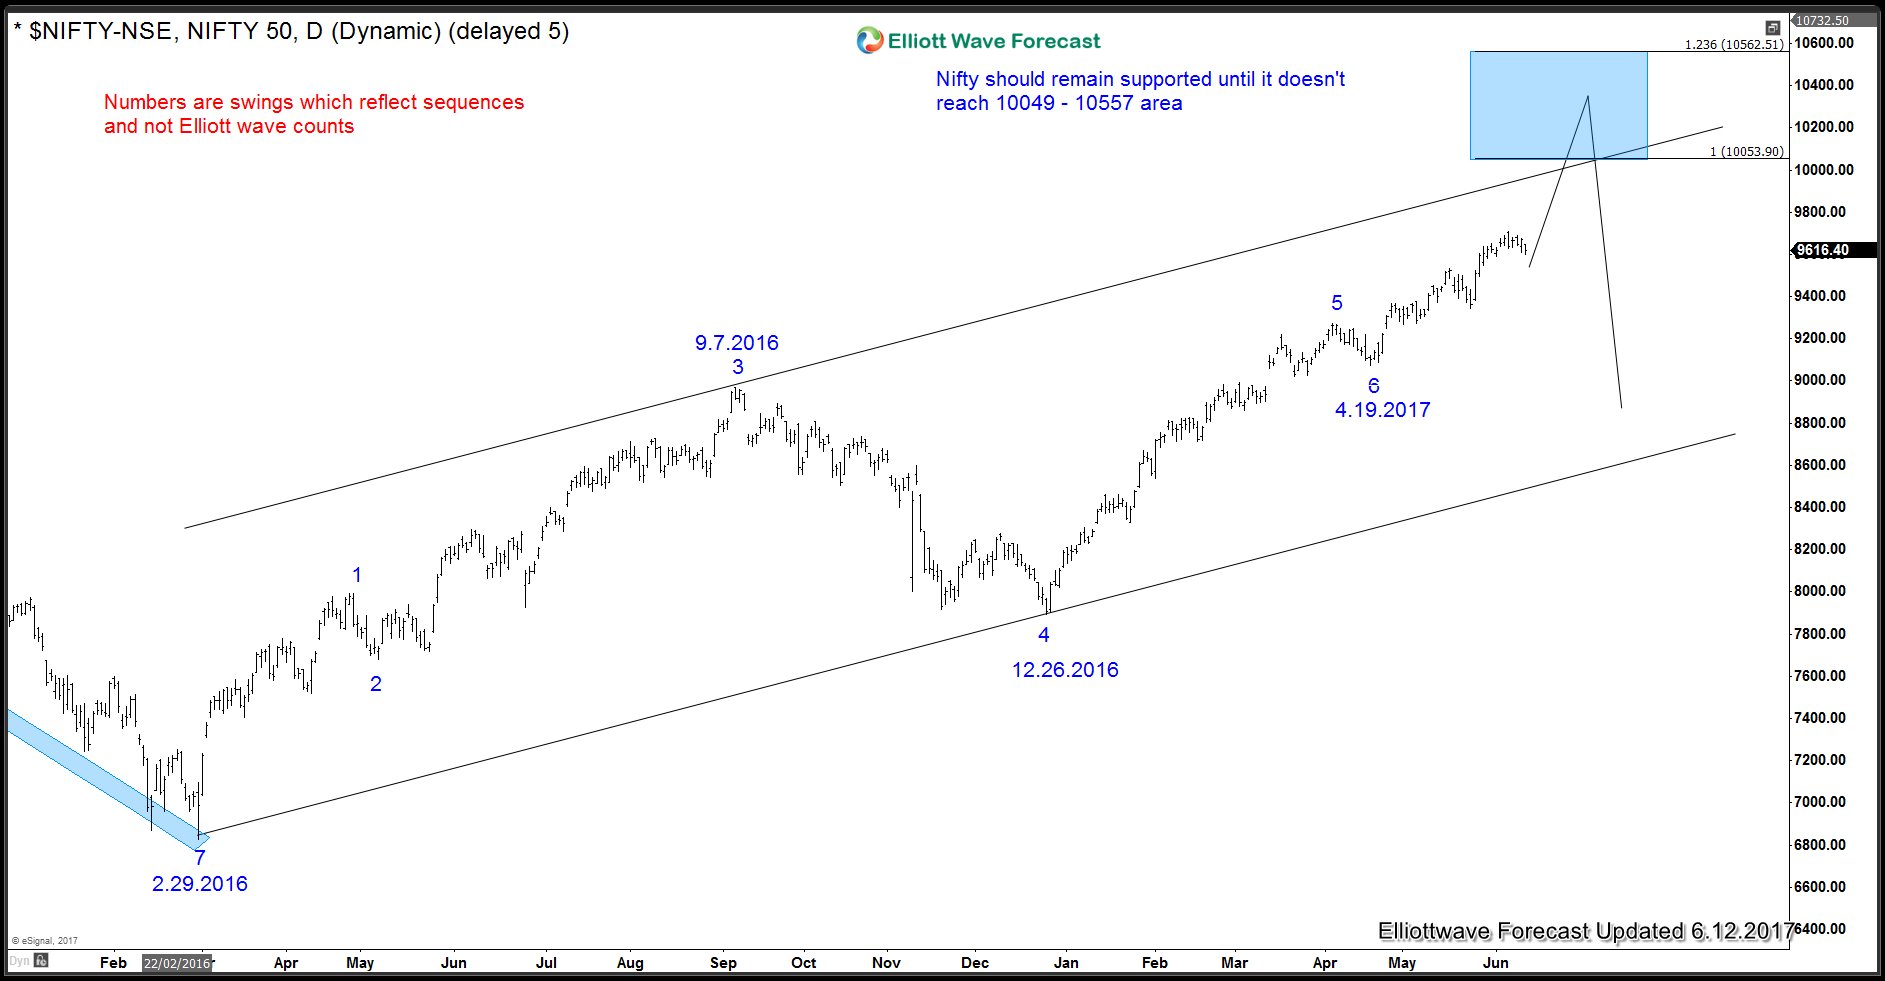
The pullback of 2018 could be also clearly anticipated. Again, the indian stock market index $NIFTY has provided the clue. After the pullback of 2015, the Index has performed a strong rally. Hereby, it made another seven swings corrective sequence higher into another Blue Box area. This time, we have 7 swings from 2016 and we have also 15 swings since the all-time lows. Combination of both should provide an enhanced effect. Indeed, World Indices pulled back and the Blue Box area has proven to work one more time. The following chart is presenting the idea and shows how we were expecting the pullback from the area.
Pullback in Indices of 2020
Last not least, we are looking for the pullback in the World Indices of this year 2020. Back those weeks, we could anticipate the pullback to happen because we were able to identify five waves from the lows in 2009. In fact, many Indices, ETF’s and Stocks were showing five waves higher from 2009 lows. Here is a chart from the last year 2019 showing the pullback in $SPY to happen in the coming years.
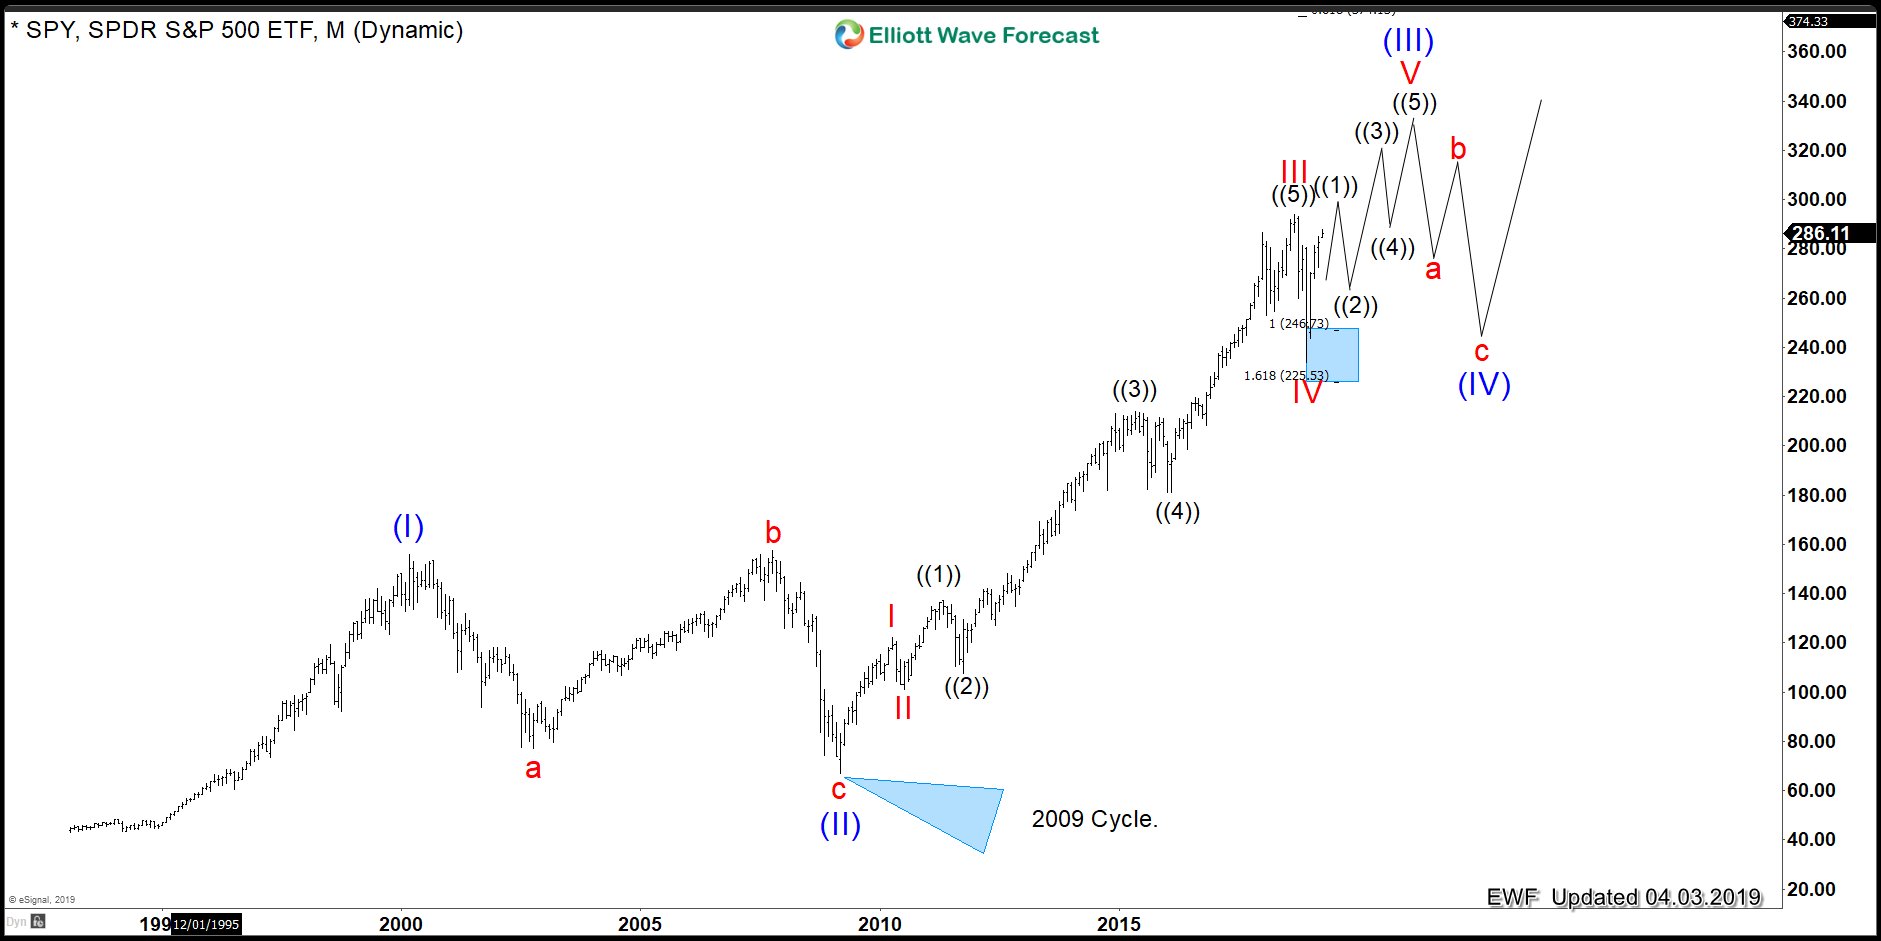
We at Elliott Wave Forecast were looking for a top to occur during the year 2020. And it did happen, during February-March 2020. .
Summary
In this article, we have demonstrated the pullbacks in the Indices can be forecasted. Also we have underlined the importance of the idea that, by nature, the trend in Indices is always bullish. Therefore, ability to see the pullbacks offers a great opportunity to buy again and, consequently, make a profit. We have done it successfully over many years. Very soon, once again, another pullback in Indices will be takings place. This time around, Japanese index Nikkei $NKD is giving us the clue. From the lows on March 2020, the Index is showing a very well defined five waves structure. It gives us a clear warning signal. Even though the Indices may still extend higher within the cycle from the March 2020 lows, soon, the biggest pullback since March is about to happen. The following chart is showing the five waves higher including the internal subdivisions.
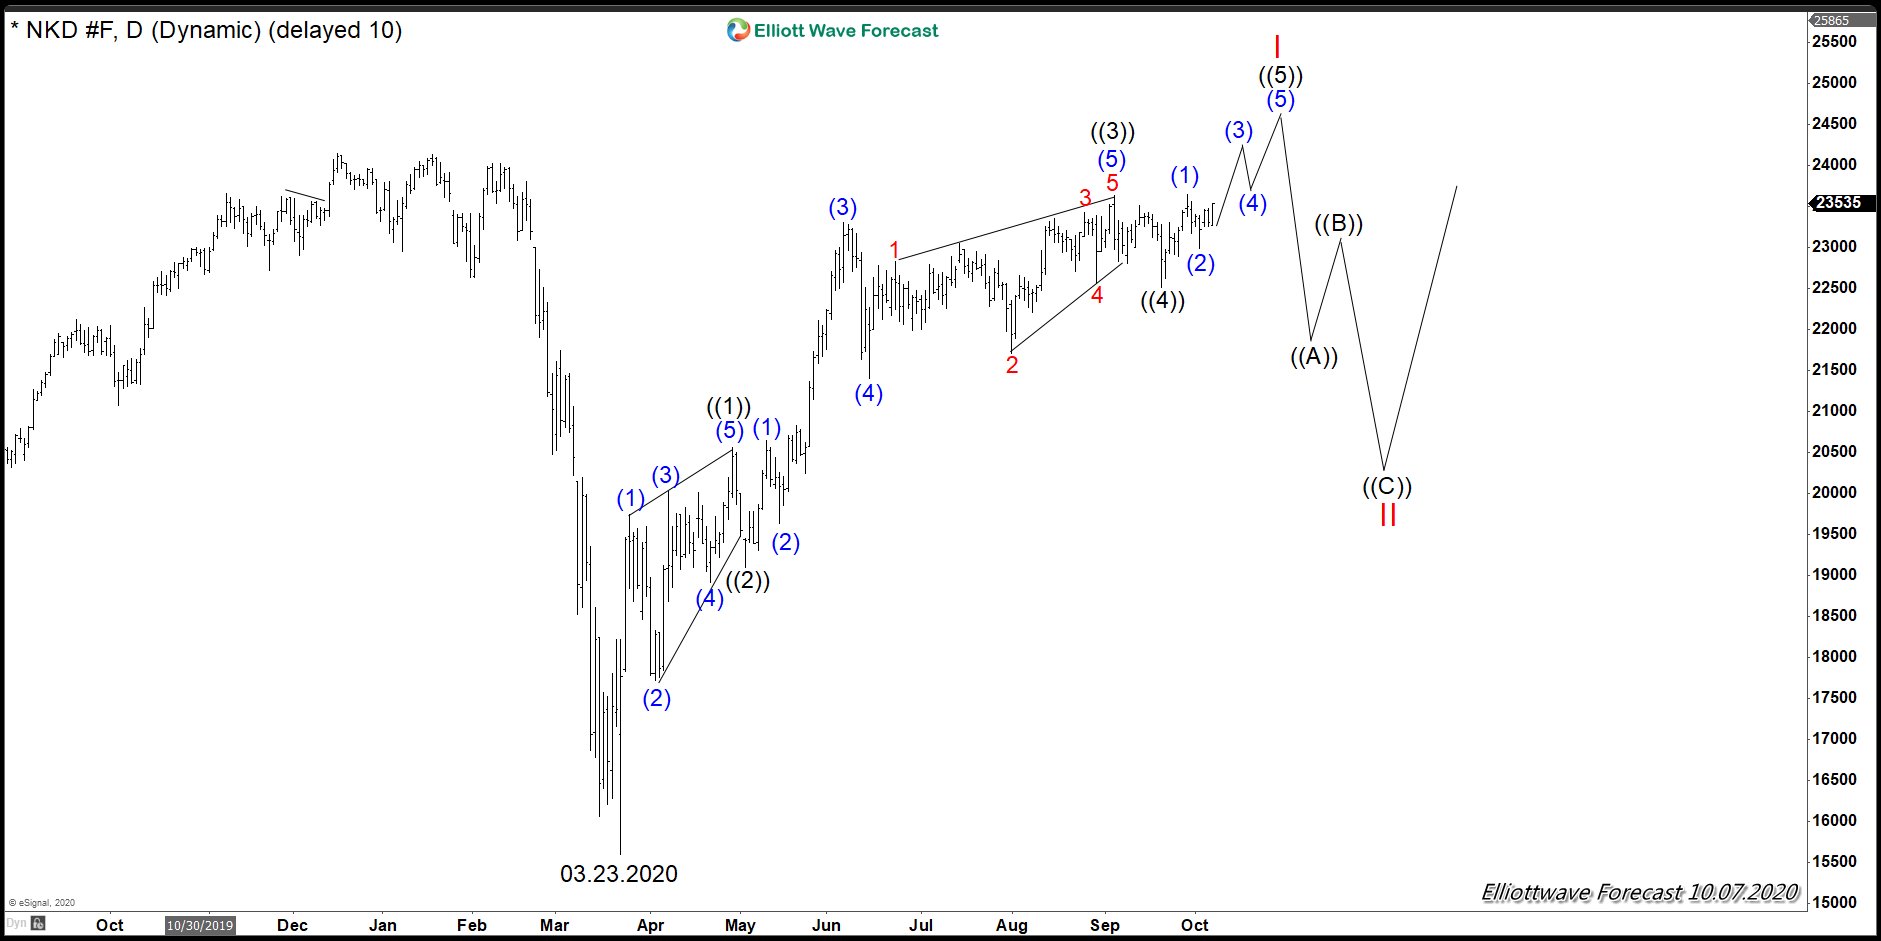
The chart shows also the expected pullback. Smart Money is just about to make the move.