As we have anticipated and communicated in every opportunity, world indices keep trading into new all-time highs. They should still continue to extend in years to come. It is easy to try picking the tops after the rally since 2009 by looking for completion of five waves and pointing at the momentum divergence. At EWF, we always look around the entire Market for clear instrument to provide us with the edge into the next cycle.
We do understand the market does not move in a straight line, and soon cycle degree from December 2018 low might be ending. When this cycle ends, a higher degree correction should happen and it will provide another excellent opportunity to buy for the next leg higher. We are looking for two main points to validate the extension higher the world indices. First, we are looking at the $SPX. We have been waiting for the 3189 levels to be reached to confirm that the grand super cycle is making five waves advance.
$SPX Extends Higher Within Wave (III) - World Indices Remain Bullish
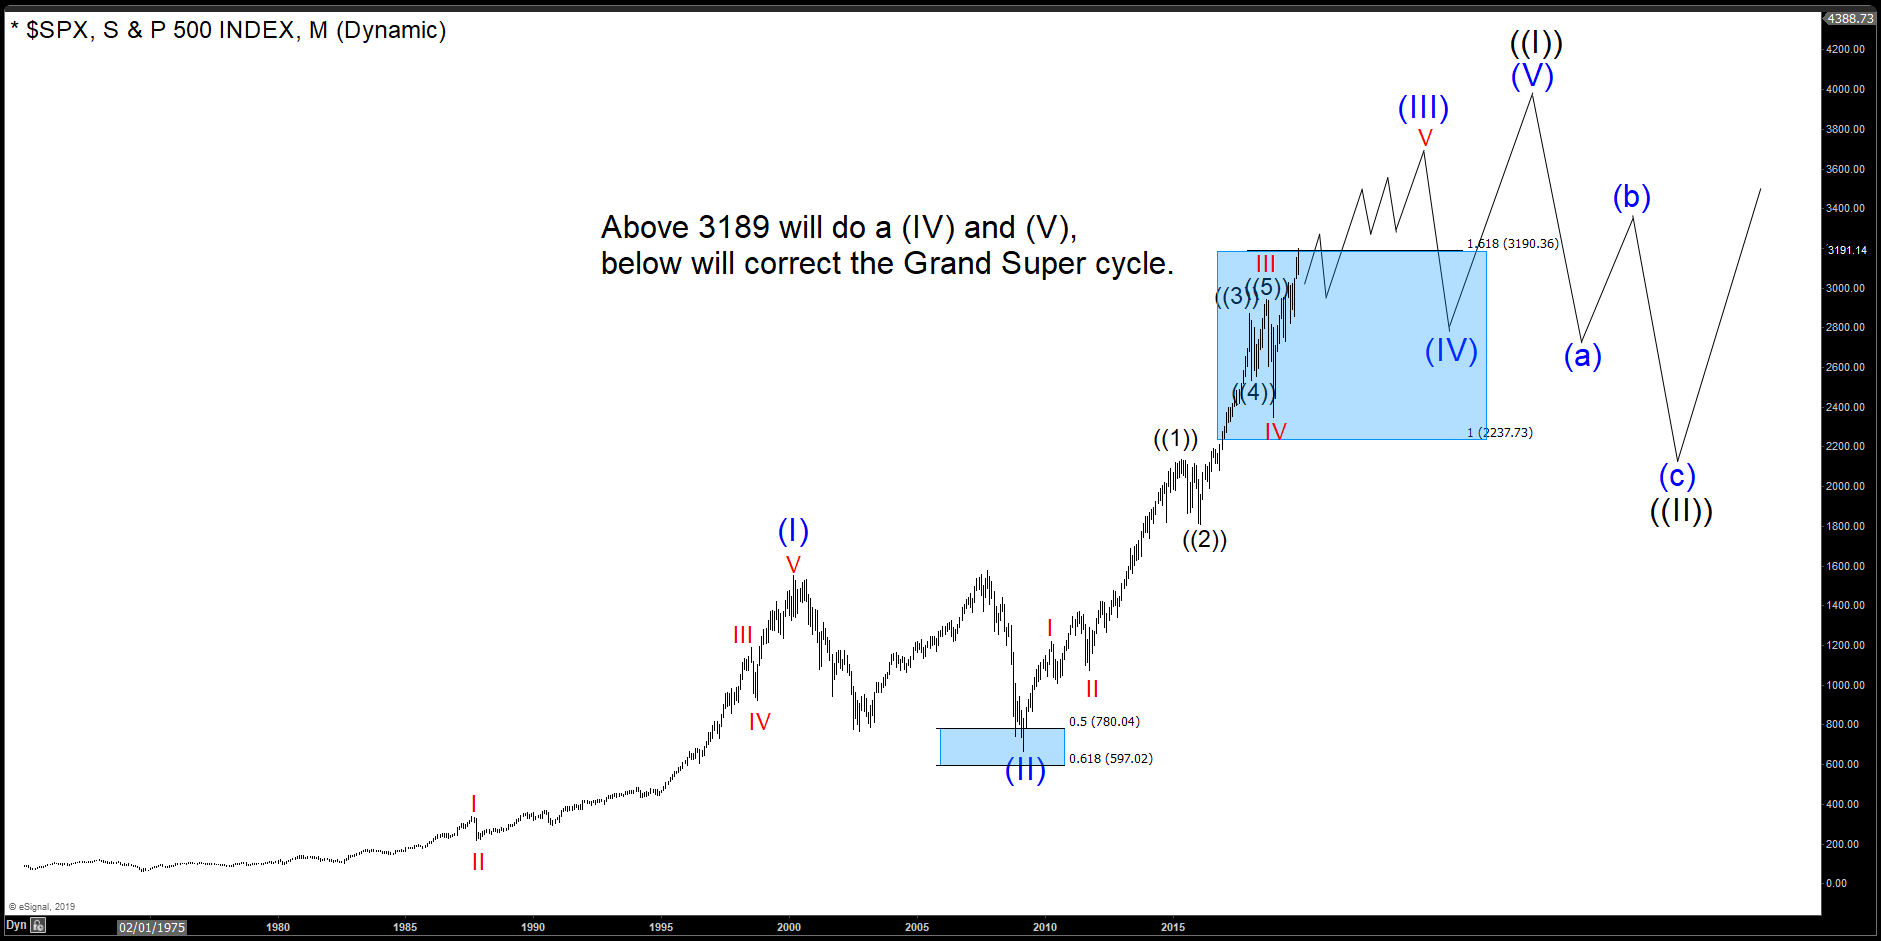
Breaking 3189 supports the the idea that $SPX is still within wave three due to the extension. Therefore, more upside is likely to happen and $SPX can reach over 4000-4500 sometimes into the future. In five waves impulse, typically one of the cycles will extend, and usually it’s wave 3 that extends. Breaking 3189 makes the cycle from 2009 low showing extension. 3189 is the 161.8% Fibonacci extension from 0 to year 2000 high, related to year 2009 low. This is the method to measure a wave three extension. We are now trading above that level and should extend still from 2009 low before ending wave (III). This also supports the idea there is further extension in wave (V) later after cycle from 2009 low ends and larger wave (IV) pullback happens.
ASX 200 from Australia Broke Above 2007 High Shows Bullish Sequence
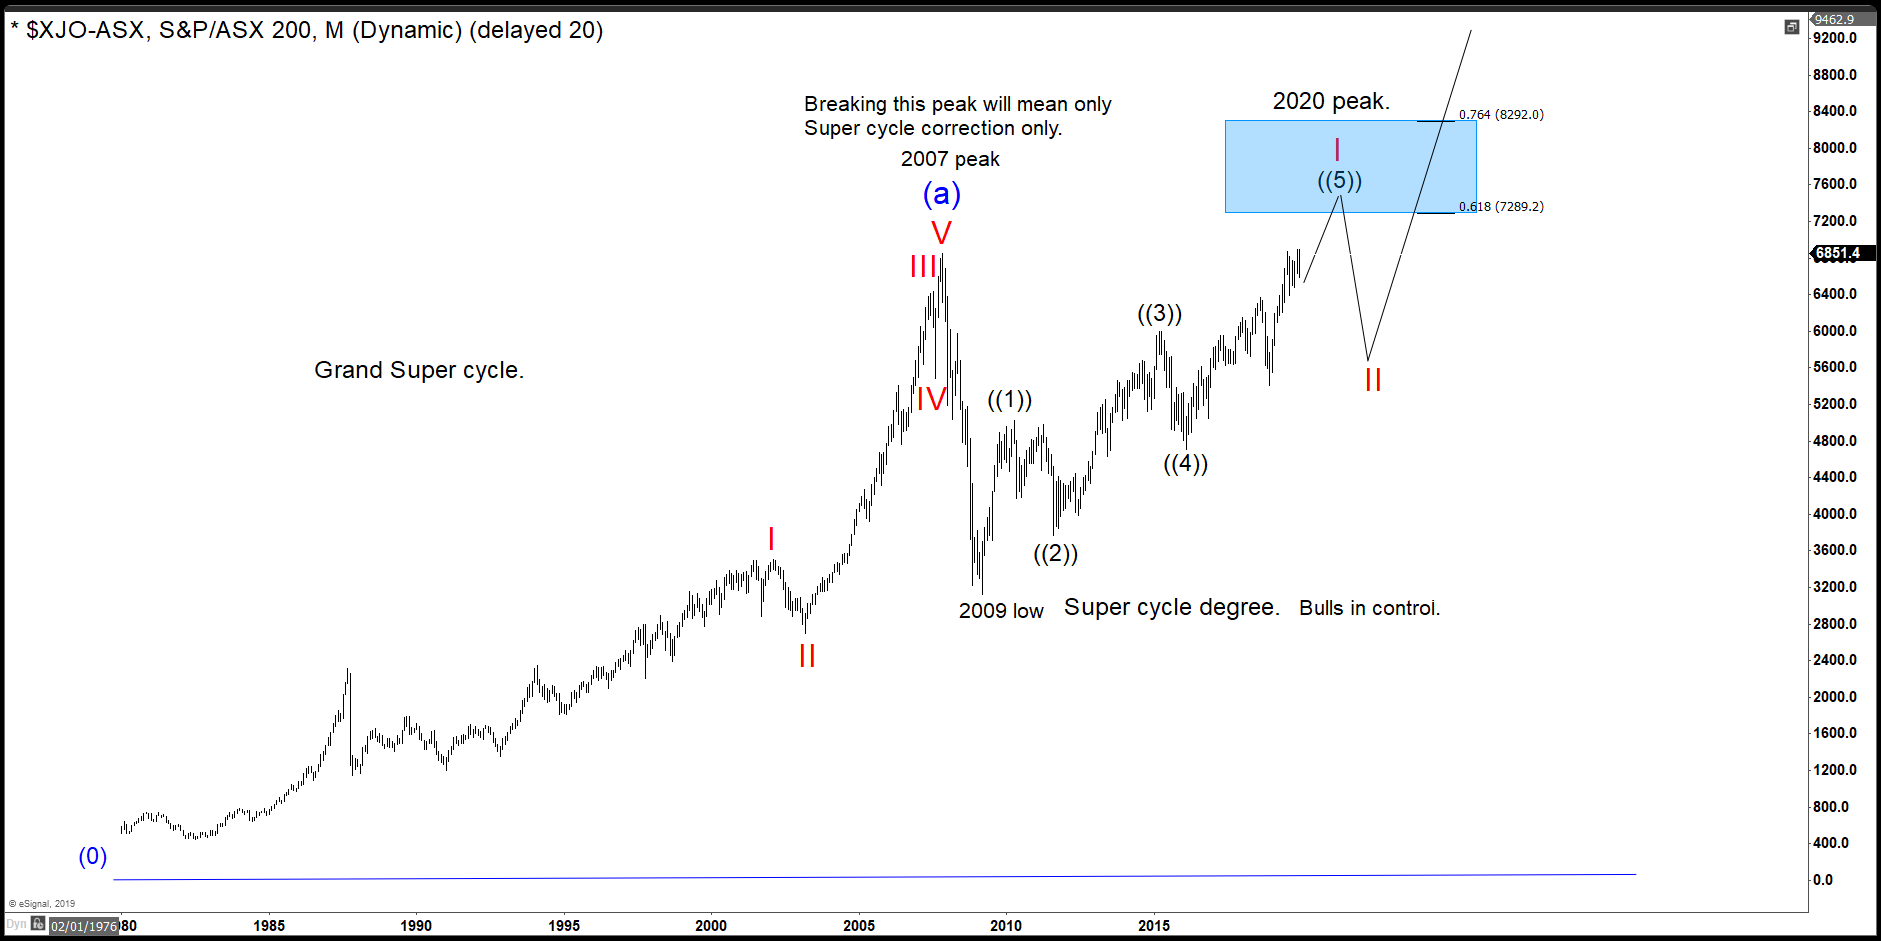
Secondly, we at EWF are looking at Australian Index $XJO-ASX 200. It is a market-capitalization-weighted and float-adjusted stock market index of stocks listed on the Australian Securities Exchange. The Index is maintained by Standard & Poor’s and is considered the benchmark for Australian equity performance. This Index is important because the Grand Super Cycle peak in year 2007 happened late compared to other Indices like $SPX, $SPY, which peaked in year 2000.
This discrepancy is critical because ASX 200 is now showing a bullish sequence within the Grand Super cycle against 2009 lows. The Index should reach 7289-8292 area sometimes next year and creates a three waves pullback. This should represent a wave (IV) pullback in $SPX. Despite the pullback, direction and intention remain clear. The chart above suggests extension higher for another ten years after the 2009 cycle ends.
Seeing that our two points are met, we believe that World Indices are here for an up and running extension. Year 2020 might be the end of the cycle from 2009 low, but it’s not the crash everyone is waiting.